How to Read an Options Chain: Every Column Explained
An options chain looks like a wall of numbers — but every column tells you something precise. This guide decodes Bid, Ask, Strike, Delta, IV, and Open Interest row by row, so you can read any options chain and immediately know which contracts are liquid, fairly priced, and worth trading.
- The Options Chain is the essential tool you must read before placing any options order — it contains every available strike price, expiration date, premium, and liquidity metric for a given underlying
- Every column has a precise meaning: Bid/Ask (premium quotes), Strike (strike price), Volume/OI (liquidity), Delta/IV (risk indicators)
- Liquidity — measured by Volume and Open Interest — is one of the most overlooked yet most important factors when selecting a contract. Low-liquidity contracts carry wide bid-ask spreads and high entry/exit costs
- This article walks you through a real options chain from start to finish, so the moment you open IBKR you know exactly what you're looking at
📋 What Is an Options Chain?
An Options Chain is a complete quote board that lists, for a single underlying stock, every available strike price across every available expiration date. You'll find it on platforms like IBKR as soon as you pull up options for any ticker.
Think of it as a menu. Different strike prices, different expirations, different premium prices — all laid out for you to compare. Your job is to pick the combination that best fits your strategy.
Once you understand what each column means, what looks overwhelming becomes your competitive edge.
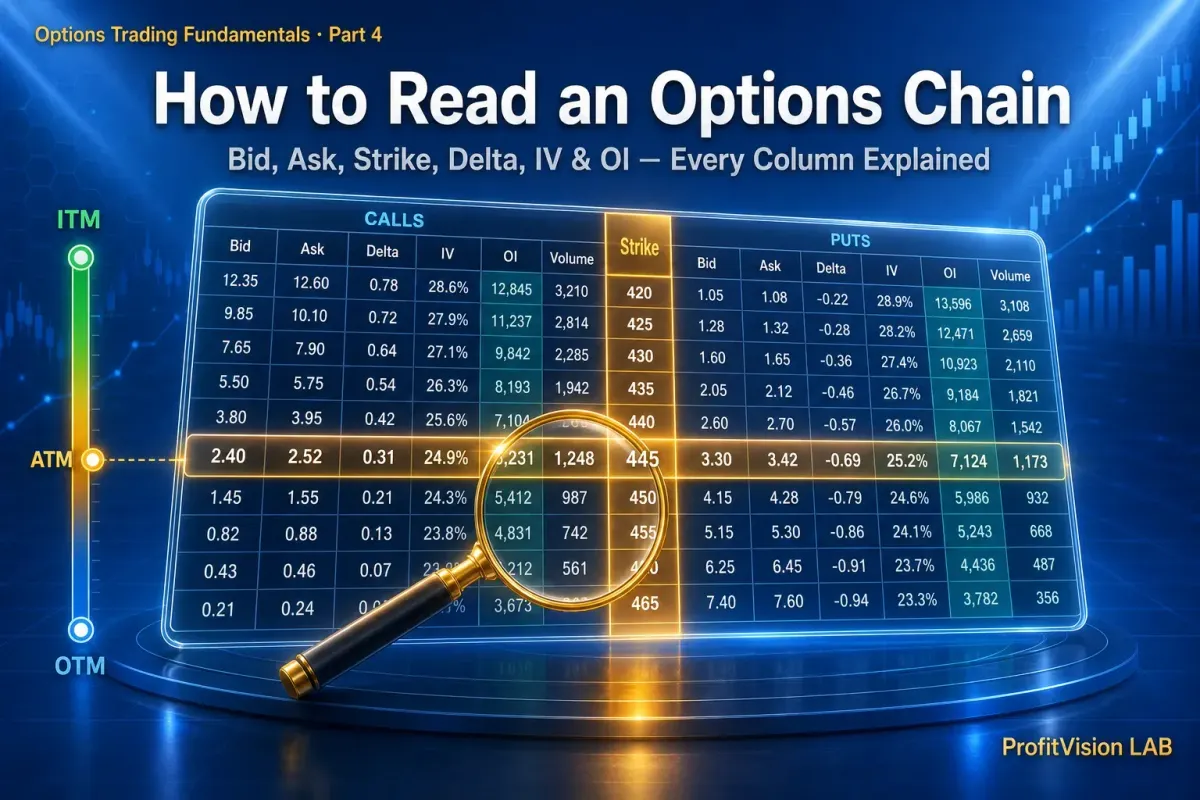
📊 What a Full Options Chain Looks Like
Using AAPL (Apple) as an example — stock price $200 — here is a simulated Put side options chain with 45 days to expiration (data is illustrative):
| Bid | Ask | Vol | OI | Strike | Delta | IV% | Theta |
| 22.10 | 22.60 | 890 | 4,200 | 220 | -0.72 | 28% | -0.08 |
| 12.30 | 12.80 | 1,240 | 5,800 | 210 | -0.60 | 26% | -0.11 |
| 6.80 | 7.10 | 3,500 | 12,000 | 200 ← ATM | -0.50 | 25% | -0.14 |
| 3.20 | 3.50 | 2,100 | 8,500 | 190 | -0.30 | 27% | -0.12 |
| 1.40 | 1.60 | 1,800 | 6,200 | 180 ⭐ | -0.18 | 29% | -0.09 |
| 0.55 | 0.70 | 620 | 2,800 | 170 | -0.09 | 32% | -0.05 |
The green rows ($190 and $180) represent the typical target zone for options sellers: OTM strikes with Delta between -0.18 and -0.30 and sufficient liquidity (OI above 500). Now let's break down each column one by one.
🔍 Every Column, Fully Explained
🎯 How to Select a Contract: Three-Step SOP (Selling Puts)
Avoid contracts with OI below 100, bid-ask spreads exceeding 15% of the premium, or zero Volume today. These contracts have extremely poor liquidity — you can get in easily, but when you try to close the position you may not find a counterparty, or you may be forced to fill at a severely unfavorable price.
🛡️ Five Liquidity Rules for New Options Traders
Beginners should focus exclusively on high-liquidity underlyings: large-cap stocks (AAPL, MSFT, GOOGL, NVDA) and index ETFs (SPY, QQQ). These offer consistently tight bid-ask spreads and deep Open Interest — the ideal training ground before expanding to smaller names.
Strikes like $180, $185, and $190 attract the most market participants, carry the highest OI, and offer the best liquidity. Avoid non-standard strikes like $182.50 or $187.50 — they trade sparsely and you're more likely to get stuck between the Bid and Ask.
Monthly options (expiring on the third Friday of each month) typically carry far higher Volume and OI than weekly options. Liquidity is deeper and Theta decay follows a more predictable rhythm. Start with monthlies and graduate to weeklies once you're comfortable.
If the bid-ask spread exceeds 10–15% of the premium, the trade starts with a structural disadvantage. Better to pass than to chase a premium under bad conditions. In options, winners are often defined not by how often they trade, but by knowing when not to.
The U.S. market offers thousands of stocks and dozens of liquid ETFs. High-quality setups exist every single week. Never rush into a contract that fails your criteria just because you fear missing out. A trade that starts with a bad entry is spent fighting a disadvantage from the open.
"Good trades are waited for, not chased."
Currently focused on U.S. options selling strategies, using a systematic framework to screen candidates and manage risk. The investment methodology integrates CANSLIM & SEPA screening discipline, a four-filter entry standard, and Bull Put Spread position management — building a repeatable, probability-driven edge on the structural advantages of time decay.
Core belief: "I teach you how to think, not just what to do."
Disclaimer: All content in this article is for research and educational purposes only and does not constitute investment advice. Options trading involves substantial risk. Investors should assess their own risk tolerance and make independent decisions accordingly.
© 2026 ProfitVision LAB · Shiba the Disciplined · I teach you how to think, not just what to do


Comments ()