
Constellation Energy (CEG) Deep Research: Nuclear Power's Second Act in the Age of AI
America's largest nuclear operator at the center of AI's power crisis. Constellation's 32.4 GW fleet is the only 24/7 carbon-free baseload at scale. MSFT & Meta locked 20-year PPAs. EPS follows a PJM 3-year cycle — not linear growth. PVL: ✅ Deep Research.
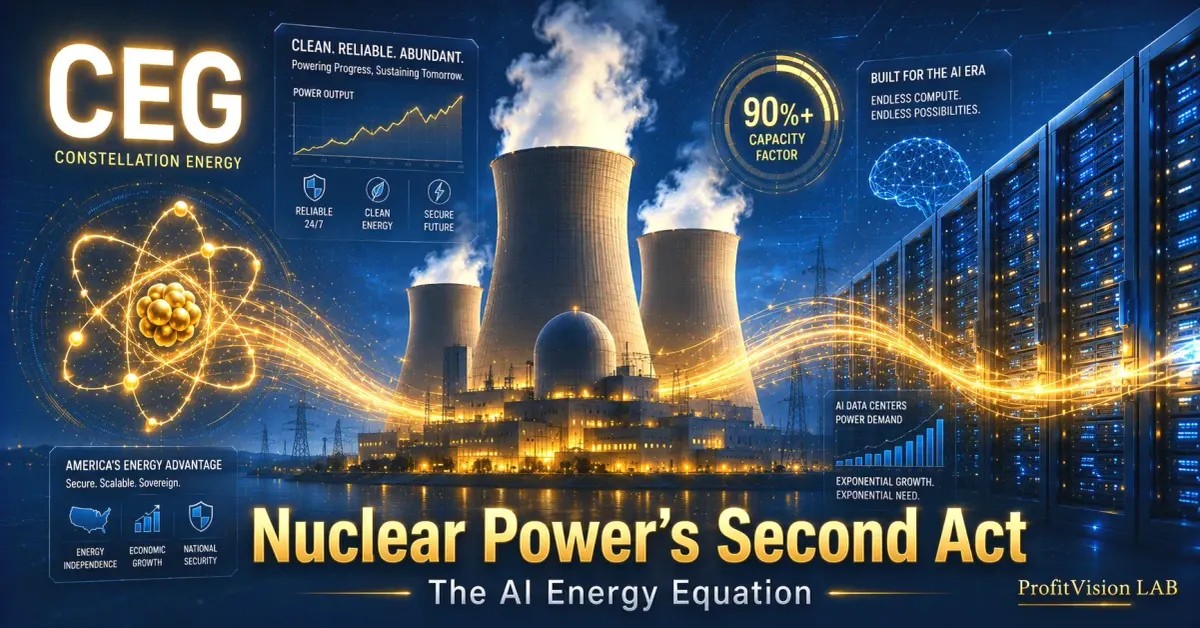
Carbon-Free Baseload × Jevons Paradox × 20-Year PPAs × Calpine Integration — The Power-Side Core of the AI Infrastructure Stack
2026.05.27 | Shiba the Disciplined | ProfitVision LAB | Last Updated: 2026.05.27
🔍 PVL Four-Filter Defense Screen
| Filter | Indicator | Assessment | Verdict |
|---|---|---|---|
| Filter 1: Institutional Flow | PV Institutional Buy Strength / Relative Strength | AI power theme driving active institutional accumulation; nuclear scarcity premium gaining market recognition | ✅ Clear |
| Filter 2: Economic Moat | Five Moat Checklist / Physical Asset Barrier | Scale ★★★★★, Switching Costs ★★★★★; nuclear fleet is irreplicable, 20-year PPAs legally binding | ✅ Clear |
| Filter 3: Volatility | IV Rank / Utility Volatility Profile | Stable utility-grade underlying with higher-than-average activity from AI power narrative | ✅ Clear |
| Filter 4: Technical | Price vs. Moving Averages / Trend | AI power theme in primary uptrend; long-term trend structure intact | ✅ Clear |
🏰 Five Moat Checklist (M5)
Chapter 1: Industry Landscape — AI's Electricity Crisis and the Nuclear Baseload Answer
Most AI investment discussions stop at chips, models, and software platforms. But there is one constraint that rarely receives the attention it deserves — and it is quietly emerging as the binding limit on the entire industry's expansion: electricity.
A single ChatGPT query consumes roughly 10 times the electricity of a standard Google search. An AI training cluster running 1,000 H100 GPUs continuously for one month draws electricity equivalent to approximately 1,700 average U.S. households for a full year. Based on current hyperscaler capital expenditure trajectories, global AI data center power consumption is projected to reach 400–1,000+ TWh annually by 2030 — a 5- to 10-fold increase from 2023 levels. The entire United States consumes roughly 4,000 TWh per year; AI, within a decade, could demand the power infrastructure of several mid-sized countries.
Baseload power is electricity generation that runs continuously, 24 hours a day. Nuclear power is the quintessential baseload source — a nuclear plant's capacity factor (the percentage of time it runs at or near full output) is 90–93%, meaning it delivers firm power for more than 90% of all hours in a year.
Solar's capacity factor is roughly 20–25% (daylight only); wind is 30–35% (weather-dependent). For AI training workloads, this is a fatal limitation — model training interrupted by a power disruption must often restart, making 24/7 stable power a hard requirement, not a premium feature.
Even with battery storage, solar + lithium-ion only covers 4–8 hours. Long-duration storage capable of bridging multi-day low-solar periods remains in early commercial stages, at costs far above nuclear. The conclusion: among all scalable clean energy options available today, only nuclear simultaneously satisfies 24/7 uptime, zero carbon emissions, and gigawatt-scale output — the three non-negotiable criteria for AI data center power procurement.
In 1865, British economist William Stanley Jevons observed a counterintuitive phenomenon: as steam engine efficiency improved dramatically, Britain's total coal consumption rose rather than fell — because more efficient machines made energy cheaper to use, which drove explosive adoption. This pattern — "efficiency gains lead to increased total consumption" — is now known as the Jevons Paradox.
The AI chip industry is living through an identical dynamic. Nvidia's Blackwell GB200 delivers roughly 25x the inference efficiency of the H100 per watt — yet rack-level power density has climbed from 10 kW (traditional compute) to 120 kW (full Blackwell rack). More efficient chips lower the cost per AI inference → more people adopt AI → more novel applications emerge → total compute demand grows exponentially. OpenAI's o3/o4 reasoning models consume roughly 100x the compute per query of GPT-4. That single data point explains the power equation entirely.
⚠️ Investment implication for CEG: Chip efficiency gains are not a threat to AI electricity demand. Every prior generation of computing efficiency improvement — mainframe to PC, PC to cloud, cloud to AI — resulted in higher absolute electricity consumption, not lower. For a 5- to 10-year investment horizon, the Jevons Paradox is arguably the single most powerful structural backstop for CEG's revenue base.
Within ProfitVision LAB's Four-Layer AI Investment Map, Constellation Energy is the flagship holding in Layer 1 — Compute & Power, on the power-supply side. CEG does not make chips, does not write software — but it provides the foundational fuel that allows every GPU and XPU to function. Without electricity, all the silicon in the world is inert metal.
enrichment, fuel rod fabrication
+ Calpine 23 GW
L1 Power-Side Core
Google / Amazon
AI Data Centers
LLM Training / Inference
AI Services
Chapter 2: Business Model & Economic Moat — Nuclear Fleet × Calpine × PPA Lock-In Flywheel
Constellation Energy's core business model follows a three-stage structure: generate → sell → lock in at premium. It owns generation assets (nuclear + Calpine's natural gas and geothermal), sells power into wholesale markets and the PJM capacity market, and — critically — executes long-term 20-year Power Purchase Agreements with hyperscalers to lock in a premium, contracted revenue stream.
The Core Asset: 21 Nuclear Plants — An Irreplicable Physical Barrier
Constellation owns and operates 21 nuclear plants with 32.4 GW of nuclear capacity — America's largest nuclear operator by a factor of more than 2x over its nearest competitor. The moat is physical and structural:
- 10–15 year build timeline: Even with approval today, a new nuclear plant cannot generate power until at least 2040
- 5–10 year NRC licensing process: The Nuclear Regulatory Commission's review is exhaustive and non-compressible
- Fully depreciated, ultra-low marginal cost: CEG's plants have operated for 30–50 years; most capital costs are fully amortized, leaving marginal generation costs of just $20–30/MWh — making them nearly unbeatable in competitive wholesale pricing
- License extension optionality: CEG has begun filing for 60-to-80-year license extensions at select sites. If approved, decommissioning costs are deferred 20 years and asset life expands — an undervalued embedded option
The Calpine Acquisition: From Nuclear Specialist to Full-Spectrum Clean Energy Platform
The $16.4B Calpine acquisition completed January 7, 2026, transformed Constellation from a "nuclear pure play" into a "full-bandwidth clean energy supplier":
| Asset Type | Calpine Contribution | Pre-Acquisition (CEG) | Combined |
|---|---|---|---|
| Nuclear | — | 32.4 GW (21 plants) | 32.4 GW |
| Natural Gas | ~23 GW (72 facilities) | Minimal | ~23 GW |
| Geothermal | The Geysers, CA (world's largest) ~725 MW | — | ~725 MW |
| Total Capacity | — | ~55 GW | |
Calpine's natural gas fleet serves as the critical flexible dispatch complement: AI data centers require nuclear baseload as their long-term foundation, but demand peaks (e.g., summer cooling loads) require fast-ramping flexible capacity. Natural gas peakers fill that role precisely. Management projects the acquisition adds approximately 20% to FY2026 EPS on a full-year basis.
A Power Purchase Agreement is a long-term contract between a power generator and a buyer, specifying that the generator will supply a defined quantity of electricity to the buyer at a fixed or formula-based price over a specified period. In CEG's case, the buyers are Microsoft, Meta, and other hyperscalers building AI data centers.
The 20-year moat logic works on three levels: ① The buyer (hyperscaler) locks in power prices, protecting against market volatility while securing guaranteed supply for AI infrastructure; ② The seller (CEG) secures 20 years of predictable cash flow, enabling long-term capital planning and financing; ③ Both parties face significant exit barriers — early termination typically triggers substantial penalties for the buyer, while CEG bears no market price risk on contracted volumes.
⚠️ Key figures: Microsoft's 835 MW / 20-year PPA and Meta's Illinois agreement effectively lock in contracted revenue through 2044–2046. Even if SMR technology commercializes in the 2030s, these customers cannot switch suppliers until their contracts expire. That contractual moat is the PPA's most durable competitive advantage.
Confirmed Major AI Power Purchase Agreements
📋 Major AI Power Purchase Agreements (PPA)
- Microsoft (835 MW, 20-year): All power from Crane Clean Energy Center (the restarted Three Mile Island Unit 1) allocated to Microsoft AI data centers; plant renamed and restored to service in 2026
- Meta (20-year, Illinois): Supplying Meta's Illinois AI data center cluster; agreement effective from 2027
- PJM Capacity Market (Dec. 2025 auction): Cleared 17,950 MW of capacity, locking in approximately $2.2 billion in FY2027/28 capacity revenue
- Total Long-Term Clean Energy Agreements: Over 5,650 MW of long-term clean energy contracts confirmed or signed to date
"Our nuclear fleet is infrastructure that cannot be replicated. Technology companies have searched 20 years for clean, reliable power. The answer has always been one: nuclear. And Constellation is that answer." — Joseph Dominguez, CEO, Constellation Energy
Chapter 3: Competitive Dynamics — Traditional Utilities, Bloom Energy, Storage, and the SMR Wildcard
CEG's competitive landscape extends far beyond "nuclear operator vs. nuclear operator." In the AI PPA market, competition arrives from three entirely different directions: traditional nuclear utilities (dramatically smaller in scale), Bloom Energy's fuel cell systems (speed advantage), and small modular reactors (structural challenge, longer-term).
I. Traditional Nuclear Utilities — Supply-Side Oligopoly
| Competitor | Nuclear Capacity | AI PPA Activity | Primary Territory | Threat Level |
|---|---|---|---|---|
| Vistra Energy | ~6.4 GW (4 plants) | Actively negotiating; included in Meta's 6.6 GW nuclear package | Texas ERCOT + PJM | ★★★☆☆ |
| Duke Energy | ~10.7 GW (11 plants) | Focused on traditional utility markets; limited AI PPA participation | Southeast U.S. (non-PJM core) | ★★☆☆☆ |
| Dominion Energy | ~2.6 GW (4 plants) | Small scale; limited relevance | Virginia / Carolinas | ★☆☆☆☆ |
Conclusion: On nuclear supply, CEG's 32.4 GW exceeds the combined capacity of all domestic competitors. The traditional utility competitive threat is minimal.
II. Bloom Energy (BE) — The Heterodox Competitor That Deserves Serious Attention
Bloom Energy is not a nuclear company. It manufactures Solid Oxide Fuel Cells (SOFC) that generate electricity on-site from natural gas (or hydrogen) without grid connection. This gives it a distinct niche in AI power markets that CEG cannot easily contest.
| Dimension | Bloom Energy (BE) | Constellation Energy (CEG) |
|---|---|---|
| Technology | Solid Oxide Fuel Cell | Nuclear fission |
| Deployment Timeline | 90 days (modular on-site installation) | Existing plants already in service; new nuclear: 10–15 years |
| Carbon Emissions | Burns natural gas; 50–60% below conventional plants, not zero-carbon | Zero carbon during operation |
| Grid Independence | Fully off-grid capable — suitable for grid-constrained locations | Requires transmission; limited by grid interconnection capacity |
| Landmark AI Deal | Oracle (2.5 GW, Project Jupiter) | Microsoft (835 MW, 20-year), Meta (20-year, Illinois) |
| FY2026 Revenue Guidance | $3.4–$3.8B (+~80% YoY) | FY2026 adj. EPS guidance: $11–$12 |
BE's key advantage is speed: hyperscaler data center construction is severely bottlenecked by grid interconnection queues, which routinely stretch 5–10 years for new transmission capacity. Bloom's fuel cells can be operational in 90 days, making BE the natural "bridge power" solution for data centers waiting on grid infrastructure. Oracle's choice of BE over nuclear was not a rejection of nuclear — it was a recognition that the grid couldn't connect in time.
That said, BE is not a full substitute for CEG:
- BE burns natural gas, which cannot satisfy Microsoft's and Google's "RE100 zero-carbon" commitments
- BE's per-MWh cost is meaningfully higher than nuclear (nuclear's marginal generation cost is extremely low at $20–30/MWh)
- Hyperscalers typically combine both: nuclear for long-term baseload, fuel cells for interim or off-grid supplementation
⚠️ Bloom Energy Competitive Risk — Worth Monitoring
BE has genuine competitive standing in the "grid-constrained new AI PPA market." If hyperscaler data center siting increasingly favors locations with poor transmission access (inland, suburban, geographically isolated), BE-type solutions will capture market share that would otherwise flow to CEG. This is not an immediate risk, but investors should track the pace of BE's hyperscaler contract expansions beyond the Oracle relationship.
III. Long-Duration Energy Storage — Complementary Today, Structurally Watchable Long-Term
| Storage Technology | Maximum Duration | Gap vs. Nuclear Baseload | Threat Timeline |
|---|---|---|---|
| Lithium-Ion (Fluence, etc.) | 4–8 hours | Cannot provide 24/7 baseload; covers only brief peak demand | No material threat |
| Iron-Air (Form Energy) | 100+ hours | Technically viable; commercially unproven ($200–300/kWh cost) | 2032–2040 (long tail) |
| Flow Batteries | 8–24 hours | Intermediate storage; cannot address multi-day low-generation events | No near-term threat |
Today, storage is a complement to nuclear — making intermittent renewables more reliable, not replacing firm baseload. Long-duration storage would need to reach below $50/kWh (currently 4–6x higher) to structurally threaten nuclear baseload — a timeline of post-2035, squarely within CEG's existing 20-year PPA coverage window.
IV. Small Modular Reactors (SMR) — Near-Term Catalyst, Long-Term Variable
SMRs are reactors with output capacity below 300 MW (conventional nuclear plants typically produce 1,000–1,700 MW). The SMR thesis centers on factory prefabrication and modular assembly — the goal being dramatically shorter build times, lower construction costs, and the ability to site reactors directly adjacent to power demand (e.g., next to an AI data center campus).
Leading developers: Oklo (publicly listed; targets first commercial operation by 2030), TerraPower (Natrium technology; delayed to 2030+ due to HALEU fuel supply constraints), NuScale (holds the only NRC-certified SMR design in the U.S., but its UAMPS demonstration project was cancelled). Meta's January 2026 announcement of a 6.6 GW nuclear agreement includes both Oklo and TerraPower.
⚠️ Critical reality check: As of 2026, no SMR in the Western world has completed commercial operation. The optimistic first-mover timeline is the early 2030s; realistic large-scale deployment is post-2035.
SMR's impact on CEG operates on two contradictory vectors:
| Horizon | Impact on CEG | Timeline |
|---|---|---|
| 🐂 Near-Term Positive (0–5 years) | SMR enthusiasm lifts the entire nuclear sector's valuation multiple; AI power TAM is large enough for both CEG and SMR to grow concurrently; CEG's existing 20-year PPAs are fully insulated | Active now |
| ⚖️ Medium-Term Neutral (5–10 years) | SMRs begin limited commercial deployment; CEG may become an SMR operator (nuclear O&M expertise is the critical competitive advantage); new contract competition begins to emerge | 2030–2035 |
| 🐻 Long-Term Risk (10+ years) | SMR siting flexibility (buildable adjacent to data centers) could shift hyperscaler new-contract preferences toward SMR in the 2040s, after existing PPAs expire | 2035+ |
Chapter 4: Financial Resilience — The Z-Shaped EPS Cycle, PJM Mechanics, and FCF Durability
CEG's financials require a specialized interpretive framework unlike any other company in this research series. This is not a SaaS company with linear ARR growth — it is a power generator whose earnings are fundamentally shaped by the 3-year PJM capacity auction cycle, producing a characteristic "peak → trough → peak" Z-shaped EPS pattern. Without this framework, CEG's financials look confusing. With it, they become predictable.
PJM (Pennsylvania-New Jersey-Maryland Interconnection) is the largest power grid operator in the U.S., coordinating electricity for 13 states plus Washington D.C. — roughly 85 million people. PJM conducts an annual "Base Residual Auction" (BRA) in which generators commit future capacity availability and receive capacity payments.
The critical mechanism: capacity rates set in any given auction only materialize in revenues approximately 3 years later (e.g., the 2025 auction determines rates for the FY2027/28 capacity year). This creates a built-in, predictable lag between auction outcomes and financial results:
• 2022 auction set rates very low ($34/MW-Day) → 2024/25 capacity revenues were depressed → CEG's FY2025 EPS declined
• July 2025 auction set rates at record highs ($269.92/MW-Day, +833% vs. prior year) → FY2027/28 capacity revenues will surge → CEG's EPS should jump materially in 2027–2028
• December 2026: next scheduled auction → determines FY2028/29 capacity revenues — the most important near-term variable for CEG's post-2028 earnings trajectory
⚠️ This is the most important structural insight for CEG investors. Each PJM auction is the single most significant event for repricing CEG's 3-to-4-year forward earnings. Set it as a calendar event.
EPS Trajectory: The Honest Z-Shape
(First stable base post-Exelon spinoff)
(+137%; PJM high-rate cycle materializing)
(-22%; 2022/23 low PJM rates settling)
(Full-year Calpine + 2025 PJM high rates beginning)
| Fiscal Year | Adj. EPS | YoY | Primary Driver | Notes |
|---|---|---|---|---|
| FY2022 | ~$2.8 | — | First full year post-Exelon spinoff | Baseline establishment |
| FY2023 | $5.02 | +79% | Wholesale power price strength + stable nuclear output | — |
| FY2024 | $11.91 | +137% | 2022 PJM high-rate auction materializing + strong wholesale prices | That same year's PJM auction was ironically low |
| FY2025 | ~$9.2 | –22% | 2022/23 low PJM rates ($34/MW-Day) settling; Calpine not yet included | Cycle trough — expected, not indicative of deterioration |
| FY2026E | $11–$12 | +20–30% | Full-year Calpine integration (+20% EPS) + 2025 record PJM rates beginning to settle | Calpine contributing from Jan. 7 onward |
| FY2029 Base Target | $11.40–$11.90 | — | Management's conservative floor (excludes new PPA upside) | Bull case $15+ if new PPAs + nuclear uprates land |
⚠️ Correctly Interpreting the FY2029 Base Target of $11.40–$11.90
This figure is management's deliberately conservative base case, assuming no new AI PPAs are added, nuclear power uprates only partially complete, and capacity market rates normalize. Since FY2026 guidance already implies $11–$12, the FY2029 "base" effectively signals near-zero EPS growth from 2026 — an intentionally conservative construct. If the December 2026 PJM auction sustains high rates and new PPAs materialize, FY2029 EPS could realistically reach $15–$18 in the bull scenario, but this should not be baked into a base case assumption.
Free Cash Flow: The More Reliable Signal
FCF is a more dependable measure of CEG's cash generation capacity than EPS, because nuclear plant capital expenditure has a distinctive structure — most construction costs are fully depreciated over decades of operation, leaving maintenance capex relatively modest:
| Fiscal Year | FCF (Est.) | Primary Driver |
|---|---|---|
| FY2023 | ~$2.5–3.0B | Nuclear baseload FCF foundation |
| FY2024 | Elevated (with high wholesale prices) | High spot power prices; strong nuclear output |
| FY2025 | Modestly lower (PJM transition) | Capacity revenue temporarily reduced |
| FY2026+ | Significantly higher | Full-year Calpine natural gas FCF + 2025 high PJM rates entering |
U.S. federal regulations require nuclear plant operators to begin funding "decommissioning costs" — the future expense of dismantling plants and remediating radioactive contamination — at the start of commercial operation, using an independently managed trust account (the Nuclear Decommissioning Trust, or NDT).
Constellation's NDT totals approximately $19.4 billion (as of early 2026). In its March 2025 biennial review, the NRC confirmed all units except Peach Bottom Unit 1 as fully funded. The Peach Bottom Unit 1 shortfall is covered through a regulated rate collection mechanism with PECO (a Pennsylvania utility), which is the standard supplemental backstop under federal rules.
⚠️ Latent risks investors should understand: ① NDT assets (~60–70% equities) face return risk — a sustained equity bear market could create a future funding gap; ② The U.S. federal high-level nuclear waste repository (Yucca Mountain) remains unresolved, creating open-ended long-term waste disposal cost uncertainty; ③ If the NRC mandates more conservative cost assumptions in future reviews, additional contributions may be required. Overall, the $19.4B NDT provides substantial buffer; it is not a near-term risk driver but warrants ongoing monitoring in a bear scenario.
License Extension: The Underappreciated Upside Option
CEG has initiated NRC applications to extend select plant licenses from 60 to 80 years of operating life. If approved, decommissioning is deferred by 20 years, generating additional decades of power output and PPA signing capacity. This is a meaningful embedded option that is currently underreflected in most financial models, and could drive significant re-rating as NRC approvals materialize.
Chapter 5: Valuation & Scenario Analysis — Utility Multiple vs. AI Growth Premium
Valuing Constellation Energy is one of the most contested questions in U.S. equity markets: is it a traditional regulated utility (low multiple, high dividend) or an AI-adjacent energy technology company deserving a growth premium? ProfitVision LAB's position: CEG merits a premium well above traditional utilities, but that premium has rational bounds — anchored by the cash flow certainty of 20-year PPAs on one side, and the volatility created by the PJM cycle on the other.
Three-Scenario Framework
| Scenario | Core Assumptions | FY2027E EPS | P/E Multiple Range | Investment Implication |
|---|---|---|---|---|
| 🐂 Bull Case | Dec. 2026 PJM auction sustains $200+/MW-Day; new Google/Amazon AI PPAs announced; nuclear uprates complete on schedule; BE competition does not materially reduce new contract signings | $14–$17 | 30–40x (AI power scarcity premium fully priced in) | FY2029 EPS materially exceeds management's conservative base; market re-rates CEG as "AI power infrastructure" rather than utility |
| ⚖️ Base Case | FY2026 guidance delivered as guided; existing PPAs execute as contracted; Dec. 2026 PJM auction moderately normalizes; Calpine integration on track | $11–$13 | 22–28x (premium above traditional utility, below growth tech) | Nuclear power supply/demand imbalance supports FCF compounding; Z-shaped EPS warrants position sizing discipline |
| 🐻 Bear Case | PJM capacity rates collapse (large supply addition); hyperscalers reduce AI capex; Calpine integration overruns; Bloom Energy wins multiple AI contracts | $8–$10 | 15–18x (traditional utility reversion) | AI power premium evaporates; Calpine integration synergies fail to materialize; stock reverts to regulated utility valuation |
Key Near-Term Valuation Risk: December 2026 PJM Auction
The next PJM capacity auction (expected December 2026, determining FY2028/29 capacity year rates) is the single largest near-term uncertainty overhanging CEG's valuation. If rates hold above $200/MW-Day, the bull case gains significant credibility. If rates retreat to $60–100/MW-Day due to new supply entry, a 2028–2029 EPS downward revision becomes likely.
Chapter 6: Risk Factors — The Four Risks That Actually Matter
Any serious institutional-grade analysis of CEG must present risk factors with the same rigor as the bull thesis. Four risk categories deserve genuine attention — not boilerplate disclosure, but scenario-specific analysis.
Risk 1: PJM Capacity Auction Reversal (Highest Near-Term Risk)
The December 2026 PJM auction will set capacity rates for the FY2028/29 period. Rates depend on the supply/demand balance in the PJM footprint. If significant new generation resources enter the market — new gas peakers, demand response programs, or accelerated renewable-plus-storage deployment — the clearing rate could fall sharply from 2025's record $269.92/MW-Day. A retreat to $60–100/MW-Day would compress CEG's FY2028/29 capacity revenue and potentially trigger another EPS trough. This is the single most material financial risk for the 2027–2030 period.
Risk 2: Bloom Energy and Off-Grid AI Power Competition
BE's Project Jupiter (Oracle 2.5 GW) demonstrates that hyperscalers with grid interconnection constraints will opt for 90-day deployable fuel cells over multi-year grid connection wait times. If AI data center siting increasingly prioritizes locations with poor transmission access, BE captures a disproportionate share of new contract activity at the expense of grid-dependent providers like CEG. This is a market share risk at the margin, not an existential threat — but warrants active monitoring of BE's contract pipeline beyond Oracle.
Risk 3: Nuclear Plant Aging and Unplanned Outages
CEG's 21 nuclear plants have operating histories of 30–50 years. Aging infrastructure elevates the risk of unplanned outages, equipment failures, and regulatory-driven safety upgrades. A significant unplanned outage at a major plant (e.g., a reactor providing 1+ GW under a Microsoft PPA) could trigger both revenue disruption and regulatory scrutiny. The NRC's oversight regime is stringent; any material safety event could result in extended downtime. This risk is partially mitigated by the breadth of the fleet (diversification across 21 plants) but is not eliminable.
Risk 4: Nuclear Decommissioning Trust (NDT) Adequacy Under Adverse Scenarios
CEG's $19.4B NDT is invested approximately 60–70% in equities. A sustained equity bear market could reduce NDT balances below NRC-required minimum levels, forcing additional cash contributions and reducing FCF available for shareholder returns or capital deployment. Additionally, the unresolved status of the U.S. high-level nuclear waste repository (no permanent storage facility exists, pending a political resolution to the Yucca Mountain program) introduces open-ended uncertainty into final decommissioning cost estimates. While neither risk is acute in the near term, both are genuine long-horizon liabilities that investors should include in scenario modeling.
Chapter 7: Investment Thesis & Tactical Outlook — Upgraded, But Enter With Full Cycle Awareness
Constellation Energy is the only non-technology company in this seven-stock AI research series — yet its growth logic is more direct than many pure-tech names: AI requires electricity, electricity requires nuclear, Constellation has nuclear at an unmatched scale. All four filters of the Four-Filter Defense Screen are clear; PVL rating upgraded from Watch List to ✅ Deep Research.
The upgrade was triggered by four concurrent developments: Calpine acquisition completed (adding 23 GW and 20% EPS), Microsoft and Meta 20-year PPAs executed (locking revenue to 2044–2046), PJM capacity revenue visibility materially improved (Dec. 2025 auction secured ~$2.2B in FY2027/28), and NDT adequacy confirmed by NRC biennial review.
Upgraded status does not mean "enter without understanding the risks." Three analytical insights from our deep-dive discussion are prerequisites for a well-formed position:
- EPS is Z-shaped, not linear — the correct evaluation horizon is 5-year average EPS, not year-over-year comparisons
- Bloom Energy is a genuine partial competitor in grid-constrained AI power markets — not a direct substitute, but worth tracking
- The Jevons Paradox ensures chip efficiency gains accelerate rather than reduce AI power demand; SMR post-2035 is a structural monitoring variable but not a near-term threat
✅ Bull Case — Three Core Arguments
- Nuclear power scarcity is a generational structural advantage: U.S. nuclear capacity has declined over the past decade; AI power demand is exploding. The wider the supply/demand gap, the greater CEG's premium pricing power. The Jevons Paradox structurally protects the demand side.
- 20-year PPA lock-in + $19.4B NDT adequacy = dual certainty: MSFT and Meta contracts lock revenue to 2044–2046; the NRC-confirmed NDT removes the decommissioning cost overhang as a near-term concern.
- Calpine's 20% EPS increment + PJM record-rate settlement converge in FY2026: Two independent positive drivers landing simultaneously in the same year creates a compelling near-term re-rating catalyst. Calpine's natural gas flexibility makes CEG a more complete AI power partner.
⚠️ Bear Case — Three Core Risks
- December 2026 PJM auction rate collapse (highest near-term risk): If new supply entry drives capacity rates significantly lower, FY2028/29 earnings face downward revision and the Z-cycle produces another trough period.
- Bloom Energy erodes new AI PPA addressable market: BE's 90-day deployment capability and off-grid flexibility could divert new AI contracts in grid-constrained geographies, creating marginal competitive pressure on CEG's long-term contract growth.
- Plant aging + NDT adverse scenario: Unplanned nuclear outages disrupt PPA delivery obligations; a sustained equity bear market could reduce NDT below NRC minimum thresholds, requiring cash contributions that compress FCF flexibility.
Options Strategy Perspective (Reference Only)
For investors with an options overlay, CEG as a ✅ Deep Research holding is a candidate for Covered Call or Cash-Secured Put income strategies — leveraging its stable utility-grade characteristics while capturing the higher implied volatility generated by the AI power narrative. PJM auction announcement windows (typically 1–2 weeks ahead of results) often generate IV spikes, creating premium-selling opportunities. Quarterly earnings calls verifying Calpine integration progress are valuation re-rating checkpoints. No specific strike recommendations are made here.
Final Conclusion
Chapter 8: Tracking Log
📋 Tracking Log
| Date | Event | PVL Assessment | Outcome / Notes |
|---|---|---|---|
| 2026/05/27 | Initial Publication | Q1 2026 Earnings + Calpine Integration Review | ✅ Deep Research (upgraded from Watch List) | — |
| 2026/08 (est.) | Q2 2026 Earnings (First full quarter of Calpine contribution) | Pending | Verify EPS run rate ≥$2.75/quarter |
| 2026/12 ⭐ KEY | PJM Capacity Auction (determines FY2028/29 capacity revenue) | Pending | Rate >$200/MW-Day → bull case; <$100/MW-Day → reassess |
Next scheduled update: After Q2 2026 earnings (est. August 2026)
Triggers for early update: New major AI PPA signing / Significant nuclear plant incident / Material PJM regulatory change / Bloom Energy major contract expansion beyond Oracle
Frequently Asked Questions
15+ years in U.S. equities and options strategy. Applies the Four-Filter Defense Screen to systematically evaluate individual stocks for operational trading quality. Research focus includes AI power infrastructure, nuclear energy market cycles, and the PJM capacity market mechanism. All research is based on public filings, SEC documents, NRC regulatory records, and earnings transcripts. Not investment advice.
Data sources: Constellation Energy SEC Filings, Q1 2026 Earnings Call Transcript, Calpine Acquisition 8-K (January 2026), PJM Capacity Market Auction Results, NRC 2025 Biennial Decommissioning Review, EPRI Power Demand Projections, Bloom Energy Investor Presentations, Public Records (as of May 2026).

Comments ()