IV Rank Complete Guide: The Hurricane Season Radar for Options Sellers
Sell insurance in hurricane season, not in calm weather. IV Rank is your radar — IVR and IVP tell you when volatility is rich enough to sell premium. Learn the math, the IVR vs. IVP difference, IV Crush mechanics, and Four-Filter Screen integration.
Sell insurance in hurricane season — when premiums are richest. IV Rank is your radar for knowing when to deploy capital and when to wait.
The Same Policy, Three Times the Price in Storm Season
A travel insurance policy costs $20 on a clear winter day. When a typhoon warning is issued, the same coverage jumps to $80 — because everyone knows the probability of a claim just spiked.
Options markets work exactly the same way.
Same stock. Same strike. Same expiration. When markets panic, option premiums can be 3 to 5 times higher than during calm periods. That "expensive vs. cheap" premium is what Implied Volatility (IV) is measuring.
But knowing IV's absolute level is not enough. What you need to know is: is the current IV high or low relative to this stock's own history?
That's the whole purpose of IV Rank (IVR) and IV Percentile (IVP) — your hurricane season radar.
IV (absolute): How strong is the current storm? (But "strong" means different things for different stocks.)
IV Rank (IVR): On a scale of 0–100, where does today's IV sit between the 52-week high and low? 100 = storm peak, 0 = dead calm.
IV Percentile (IVP): Out of the past 252 trading days, what % were calmer than today? A more precise and robust reading.
The seller's core logic: Only sell premium in hurricane season (high IVR). Never sell in calm weather (low IVR).
I. What Is IV: The Market's Fear Thermometer
Implied Volatility (IV) is the market's forward-looking expectation of how much a stock will move, derived by reverse-engineering option prices using models like Black-Scholes. It's not calculated from price history — it's priced in by the market in real time.
In plain terms: if a stock's IV is 30%, the market is implying there's roughly a 68% probability (one standard deviation) that the stock stays within ±30% over the next year.
When markets are fearful, demand for "insurance" rises — premiums get more expensive — and IV rises. When markets are calm, insurance is cheap and IV falls.
IV vs. Historical Volatility (HV)
📊 Historical Volatility (HV)
- What actually happened in the past
- Calculated from historical price data
- Known, certain number
- Backward-looking indicator
- Cannot directly price options
🎯 Implied Volatility (IV)
- Expected future volatility
- Derived from live option prices
- Real-time, dynamic number
- Forward-looking indicator
- Directly determines option premiums
The most important concept for sellers: high IV = expensive premiums; low IV = cheap premiums. Since sellers profit by collecting premium, their core mission is finding moments when IV is relatively elevated.
Long-term data consistently shows that implied volatility (IV) runs 20–30% higher, on average, than the realized historical volatility (HV) that actually occurs. This spread is called the Volatility Risk Premium (VRP) — and it's the structural foundation of options selling strategies. Markets chronically overestimate risk; sellers chronically collect that overestimate.
II. IV Rank (IVR): The 52-Week Storm Intensity Ranking
IV Rank asks one question: "Where does today's IV sit, between this stock's 52-week high IV and 52-week low IV?"
The Formula
Result range: 0–100
100 = current IV equals the 52-week high
0 = current IV equals the 52-week low
Example
Suppose a stock has:
- 52-week IV high: 60%
- 52-week IV low: 20%
- Today's IV: 50%
→ Today's IV sits at the 75th percentile of its 52-week range. Hurricane season is here — conditions favor selling premium.
IVR Interpretation Scale
| IVR Range | Storm Analogy | Premium Level | Seller Strategy |
|---|---|---|---|
| 0–20 | ☀️ Clear skies, no storm | Very low | Do not sell. Premium is too thin, risk/reward is poor. |
| 20–40 | 🌤 Light clouds, mild breeze | Below average | Caution. Reduce size. Conservative strategies only. |
| 40–60 | ⛅ Unsettled weather | Moderate | ✓ Standard entry zone — lower edge of sweet spot. |
| 60–80 | 🌧 Hurricane season peak | High | ✓ Prime entry. Rich premiums, best risk/reward. |
| 80–100 | 🌀 Eye of the storm | Very high | Evaluate carefully. Premium is excellent, but confirm it's panic — not a fundamental breakdown. |
IVR's Biggest Weakness: Outlier Distortion
IV Rank has one well-known flaw: it only looks at the 52-week high and low, so a single extreme event can permanently skew the reading.
Imagine last year featured a once-in-a-decade crash event (like COVID in 2020 or the 2022 inflation panic), where IV spiked to 120%. Today's IV is 35% — which would normally be elevated. But because the 52-week high is 120%, the IVR formula spits out:
IVR of 15 looks like "calm weather" — but in reality, 35% IV is a perfectly good entry opportunity for most strategies. One outlier event made IVR useless for months.
This is the exact problem IV Percentile solves.
III. IV Percentile (IVP): A More Precise Radar
IV Percentile asks a different question: "Out of the past 252 trading days, what percentage of those days had a lower IV than today?"
The Formula
An IVP of 70 means: 70% of the past 252 trading days were calmer than today — IV was lower on those days than it is right now.
Example
Same stock as before. Over the past 252 trading days:
- 176 days had IV below today's 35%
- 76 days had IV above today's 35%
→ Today is stormier than 70% of recent history. Good conditions for selling premium.
Going back to our outlier example: even with a 52-week high of 120%, IVP correctly reports that today's 35% is elevated relative to most days in recent history — because IVP counts actual trading days, not just the extremes. A single outlier event doesn't distort the reading.
IV. IVR vs. IVP: Which Should You Use?
📊 IV Rank (IVR)
- Simple to calculate
- Available on most platforms
- Intuitive: shows position in range
- Easily distorted by a single outlier
- Unreliable after black swan events
- Best for: quick initial screening
🎯 IV Percentile (IVP) — Recommended
- Slightly more complex to calculate
- Not available on all platforms
- Reflects actual frequency distribution
- Immune to single outlier events
- Stays accurate after market crashes
- Best for: final entry decisions
Use both together. IVR ≥ 40 for initial screening (fast scan of candidates). IVP ≥ 50 to confirm entry (more reliable signal). When both conditions are met, your entry foundation is as solid as it gets.
VIX and Individual Stock IV
VIX measures implied volatility on the S&P 500 index — the market's aggregate "fear gauge." When VIX spikes, individual stock IVs usually rise with it as fear spreads.
However, you must calculate IV Rank and IV Percentile using each stock's own IV history — not VIX. Tesla's "high IV" and Taiwan Semiconductor's "high IV" are completely different in absolute terms. Only IVR and IVP let you make apples-to-apples comparisons across names.
| Metric | Measures | Best Use | Limitation |
|---|---|---|---|
| IV (absolute) | Today's option premium richness | Compare contracts on the same stock | Cannot compare across stocks |
| IV Rank (IVR) | IV's position in 52-week range | Fast screening | Distorted by outlier events |
| IV Percentile (IVP) | Actual frequency in historical distribution | Entry decision | Not on all platforms |
| VIX | Broad market fear level | Macro market context | Cannot substitute for individual stock IV |
V. IV Crush: The Storm Passes, Premiums Collapse
This is one of the most important phenomena in options selling — and the most common trap for options buyers.
What Is IV Crush?
Before major events (earnings, Fed decisions, investor days, FDA rulings), market uncertainty is high. Investors rush to buy option "insurance," pushing IV up. When the event is announced — regardless of whether the news is good or bad — uncertainty disappears. Premium demand collapses. IV can drop 30–60% within minutes. This is IV Crush.
Storm warning issued (pre-earnings): Everyone panics and buys insurance. Premiums spike to $80.
Storm path confirmed (earnings announced): Whether the storm hits or misses, the uncertainty is gone. The same policy drops back to $20 in minutes.
That $60 gap is the structural advantage options sellers can capture around earnings season.
The Buyer's Trap
The most common disaster: a trader buys a call before earnings, the stock rallies 5% on the report — and the option still loses money.
Why: The 5% stock gain (Delta profit) is completely overwhelmed by the IV Crush loss (Vega loss). The "uncertainty premium" evaporated the moment results were published, destroying more value than the directional move created.
Buying calls or puts ahead of earnings is treacherous even when you get the direction right. Option prices include an "uncertainty premium" that evaporates the instant the event resolves — often more than the directional move is worth. Getting the direction right and still losing money is the classic IV Crush lesson. Most traders only learn it the hard way.
The Seller's Opportunity
Flip the perspective: a seller who sells premium before earnings — when IV is extremely elevated — and then buys to close after the announcement collects the IV Crush as profit. The options became much cheaper to buy back after the uncertainty resolved. This is called "selling volatility," and it's a core earnings-period strategy for disciplined sellers.
Standard setup: 1–3 days before earnings, with IV at or near its high, sell a Short Strangle or Iron Condor. After earnings, IV Crush makes the options worth far less — buy to close and pocket the difference.
Four-Filter prerequisite: The stock must pass the Economic Moat assessment (strong enough fundamentals that earnings won't cause a catastrophic breakdown). High IV + strong economic moat = the disciplined seller's best opportunity.
VI. IV Rank in the Four-Filter Defense Screen
IV Rank is the third filter in ProfitVision LAB's Four-Filter Defense Screen. Why third — not first?
Because high IV alone doesn't mean you should sell. If a company is bleeding cash, getting shorted by institutions, and breaking below key technical levels — high IV is the market warning you, not inviting you. A high-IV stock with deteriorating fundamentals is not an opportunity; it's a signal to stay away.
The Correct Sequence
| Filter | Core Question | IV's Role |
|---|---|---|
| Filter 1: Institutional Flow | Are institutions buying or selling? | Validates directional assumption |
| Filter 2: Economic Moat | Moat Checklist score ≥ 6? | Confirms high IV = temporary panic, not structural collapse |
| Filter 3: IV Rank ← HERE | IVR ≥ 40%? IVP ≥ 50%? | Confirms premium is rich enough to justify the risk |
| Filter 4: Technical Setup | CANSLIM/SEPA: trend + support? | Determines Delta placement and risk range |
Once Filters 1 and 2 pass, you arrive at Filter 3 with one question: "Is the premium rich enough to justify my risk?"
If IVR is below 30% — no matter how strong the moat or how clean the institutional flow — the premium is too thin. Wait for storm season.
IVR Thresholds by Strategy
| Strategy | Minimum IVR | Optimal IVR Range | Rationale |
|---|---|---|---|
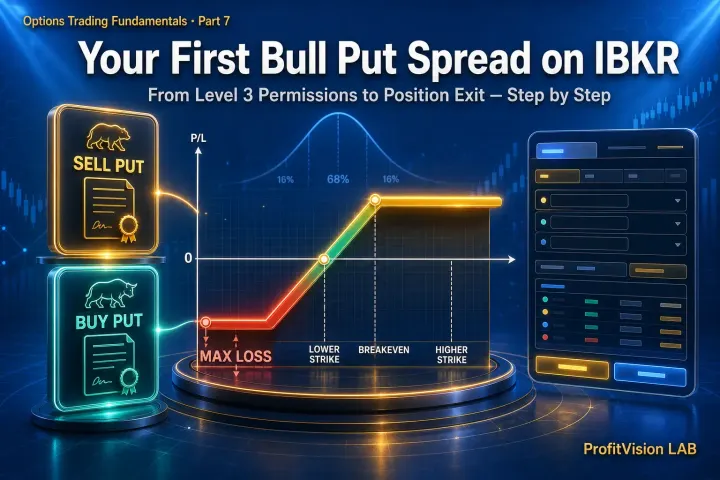
| Bull Put Spread | IVR ≥ 35 | 40–75 | Limited credit received; needs enough premium to compensate Gamma risk |
| Short Put (naked) | IVR ≥ 40 | 50–80 | Larger risk exposure; premium must be meaningfully thick |
| Iron Condor | IVR ≥ 40 | 45–70 | Two-sided structure; both sides need adequate credit |
| Covered Call / PMCC | IVR ≥ 25 | 30–60 | Long underlying provides a buffer; monthly rent collection doesn't need peak IV |
| Pre-Earnings Strangle | IVR ≥ 60 | 70–100 | Specifically targeting IV Crush; needs extreme IV to justify earnings risk |
VII. Where to Find IVR and IVP Data
| Platform | IVR | IVP | Notes |
|---|---|---|---|
| tastytrade / tastyworks | ✅ | ✅ | Best integration — IV data lives right in the order ticket. Primary platform recommendation for sellers. |
| thinkorswim (TD Ameritrade) | — | ✅ (labeled "IVP") | Available on the Trade tab for each symbol. |
| Market Chameleon | ✅ | ✅ | Free website with IV charts, IVR, and IVP. Good for scanning multiple names. |
| Barchart.com | ✅ ("IV Rank %") | — | Free basic data; useful for initial screening. |
| Interactive Brokers (IBKR) | Manual | — | Raw IV available; IVR/IVP requires manual calculation or third-party tools. |
| MarketSurge (IBD) | — | — | CANSLIM screening primary tool. Pair with tastytrade or Market Chameleon for IV data. |
CANSLIM/SEPA technical screening (Filters 1 & 4) → Economic Moat assessment (Filter 2) → Python + Claude to calculate IVR/IVP (Filter 3) → All four filters pass → Execute.
VIII. The Three Most Common IVR Mistakes Sellers Make
Mistake 1: Selling in Low IV "Because the Stock Is Good"
"This company has a great moat and strong momentum — and I need income now. I'll sell even with IVR at 15."
This is the most common and most costly error. Selling options in low IV means collecting a thin premium while accepting a fixed maximum loss. The risk/reward ratio is structurally broken.
Worse: if market volatility suddenly spikes after you enter (which is when IV tends to explode), your position immediately shows paper losses from Vega damage — even before the stock moves anywhere near your strike. You're not just accepting low reward; you're adding Vega risk you didn't price in.
Opportunities always come back. Lost capital doesn't. — Shiba the Disciplined
Mistake 2: Treating High IVR as an Automatic Buy Signal
IVR = 90 looks like a once-in-a-year opportunity. But sometimes high IV is the market saying: "Something is seriously wrong with this company."
Filter 2 (Economic Moat assessment) is specifically designed to help you distinguish between: temporary market panic (where high IV is genuinely your opportunity) vs. fundamentally-justified fear (where high IV is a warning you should heed).
Moat Score ≥ 6 + IVR ≥ 70 = The disciplined seller's golden opportunity.
Moat Score ≤ 4 + IVR ≥ 90 = The market knows something you don't. Stand aside.
Mistake 3: Comparing Absolute IV Numbers Across Stocks
"NVDA's IV is 55% — that's really high! TSM's IV is 30% — seems normal."
This comparison is meaningless without context. NVDA's "normal" IV might be 60–80%, making 55% a historical low (IVR might be 15). TSM's "normal" IV might be 20–25%, making 30% a historical peak (IVR might be 80).
Always use IVR and IVP. Never make cross-stock decisions based on absolute IV figures.
IX. Complete IV Rank Entry Checklist
- IVR Initial Screen: Is IVR ≥ 40%? (Standard threshold for Bull Put Spread / Short Put)
- IVP Confirmation: Is IVP ≥ 50%? (More than half of the past year was calmer than today)
- IV Direction: Is IV rising from a low (hurricane approaching) or declining from a peak (storm passing)? Rising = enter; declining = consider waiting for the next cycle.
- Black Swan Filter: When IVR is extreme (90+), confirm it's panic — not a fundamental problem. Check recent news, earnings reports, analyst calls.
- Event Calendar Check: Are there earnings, Fed decisions, or major catalysts in the next 14 days? If yes, assess whether to wait for the event to pass before entering (reduces Gamma risk).
- Strategy-Threshold Match: Does your chosen strategy (Bull Put Spread / Iron Condor / Short Put) correspond to the current IVR level? Low IVR → Covered Calls or PMCC only; never naked Put selling.
- First Three Filters Clear: Institutional Flow + Economic Moat (≥ 6) + IV Rank threshold all confirmed before looking at technicals for Delta placement.
Conclusion | Premium Must Be Thick Enough to Justify the Risk
Return to the insurance actuary analogy. The actuary doesn't sell policies every day. In quiet winters, premiums are too thin — not worth deploying capital. But when storm season arrives, when markets panic and people rush to buy insurance — that's when the actuary methodically deploys prepared capital to collect premiums that markets have systematically overpriced.
IV Rank tells you: Is this winter or hurricane season?
- IVR < 30: Winter. Premiums too thin. Wait patiently. Do not force trades.
- IVR 40–70: Hurricane season. Standard entry zone. Deploy systematically using all four filters.
- IVR 70–90: Peak season. Premium is rich. After strict moat verification, consider scaling position size.
- IVR 90+: Direct landfall. Premium is exceptional but risk is maximum. Apply the most rigorous moat standard before entry.
The actuary doesn't make money predicting storm paths. The actuary makes money by pricing the insurance correctly at the right time. You do the same.
With IV Rank and IV Percentile, you have the hurricane season radar. Combined with the Four-Filter Defense Screen, you become the actuary who collects premium systematically in storm season — and pulls back before the storm makes landfall.
Further Reading
Options Selling Strategy Complete Guide: Using Probability to Build a Systematic Cash Flow System Options Greeks Complete Guide: The Actuary's Four Numbers Bull Put Spread Complete Guide: Full SOP from Design to ExitI teach you how to think, not just what to do.
This content is for educational and research purposes only and does not constitute investment advice or a recommendation to buy or sell any security.
Options trading involves substantial risk. Past performance does not guarantee future results. Please assess your own risk tolerance before trading.
© 2026 ProfitVision LAB · All rights reserved.

Comments ()