- Published #1 BDC Overview: Complete Guide for Taiwan Investors
- Published #2 ARCC: America's Largest BDC Deep Research
- Published #3 HTGC: Tech BDC Leader Deep Research
- This Article #4 BDC ETF Landscape: BIZD, PBDC & Decision Framework
- Advanced #5 BDC Covered Call: ARCC × HTGC Complete Strategy
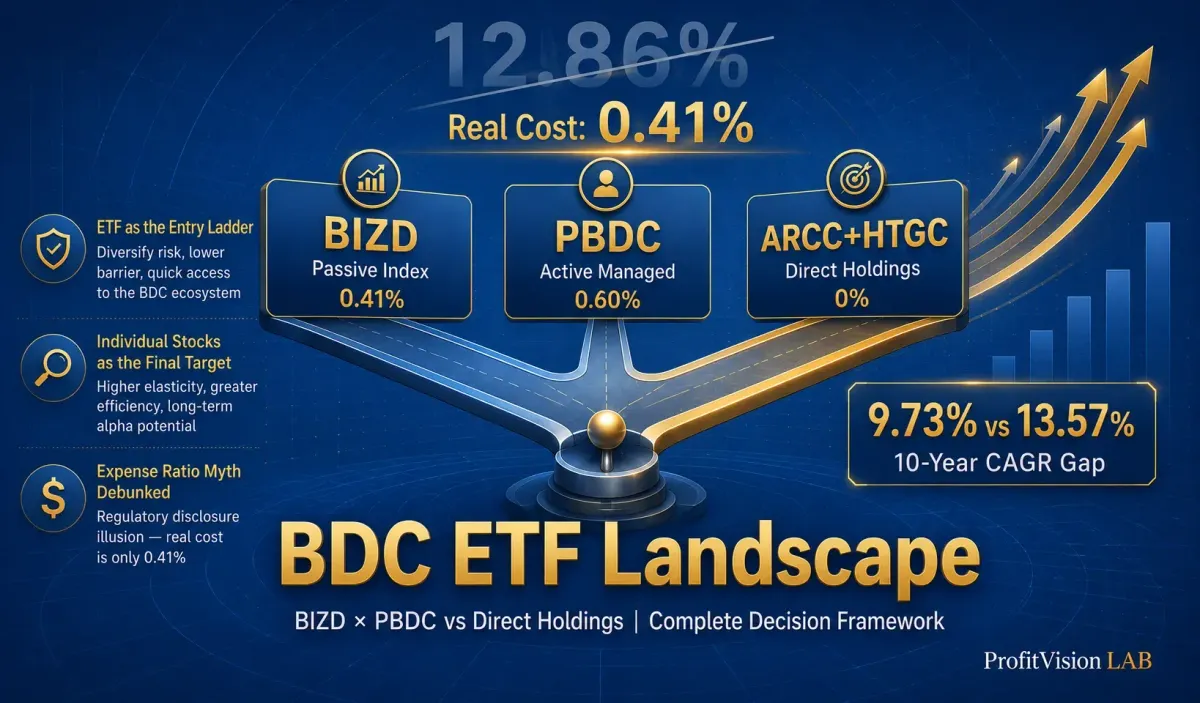
The first reaction most investors have when they research BIZD is: "12.86% expense ratio? That's highway robbery."
The number is alarming — but it is a regulatory disclosure artifact, not the cost you actually pay. Understanding this distinction is the foundation of every BDC ETF conversation.
A 2006 SEC rule requires all "fund of funds" structures — including ETFs that hold other funds — to disclose the expense ratios of their underlying holdings as part of the ETF's own total expense ratio. This line item is called AFFE: Acquired Fund Fees and Expenses.
BIZD holds approximately 50 BDCs. Each BDC has its own management fees (typically 1.5–2% base + incentive fees). The SEC requires BIZD to aggregate all of these into one number. BIZD's own direct expense ratio is only 0.41%. The 12.86% includes the underlying BDC management costs — costs you would incur anyway if you held those BDCs directly.
In other words: if you own ARCC directly, you still bear ARCC's management fees — they're just embedded invisibly in ARCC's share price. Owning BIZD carries the exact same underlying cost. The 12.86% disclosure isn't an additional charge on top of what you'd pay anyway.
| Fee Component | Amount | Notes |
|---|---|---|
| BIZD direct management fee | 0.41% | This is the only fee you're paying extra |
| Underlying BDC AFFE (indirect) | ~12.44% | You'd pay this holding BDCs directly too |
| Total disclosed expense ratio | 12.86% | SEC-mandated combined disclosure — visually misleading |
| Actual extra cost vs. direct holdings | 0.41% | The real incremental cost of using BIZD |
Once this is clear, BIZD's fee evaluation returns to normal: 0.41% for diversified exposure to ~50 BDCs is a reasonable price. The question becomes whether that diversification is worth it — which is what the rest of this article addresses.
| Profile | Value | Notes |
|---|---|---|
| Issuer | VanEck | U.S. established ETF provider |
| Index tracked | MVIS US BDC Index | Market-cap weighted index of publicly traded BDCs |
| Inception | February 11, 2013 | Most seasoned BDC ETF |
| AUM | ~$1.46B | May 2026 |
| Number of holdings | ~50 | All publicly traded qualifying BDCs |
| Direct expense ratio | 0.41% | Your actual incremental cost |
| Distribution yield (12-month) | ~11.7% | Quarterly distributions |
| 10-year annualized return | 9.73% | Dividends reinvested |
| 5-year annualized return | 12.25% | Dividends reinvested |
BIZD Top Holdings (as of end-2025):
BIZD tracks a market-cap weighted index, meaning it must hold every qualifying publicly traded BDC — including lower-quality names like Prospect Capital (PSEC). You cannot concentrate only in ARCC, MAIN, and HTGC. Diversification cuts both ways: it reduces single-name risk, but also dilutes the outperformance of high-quality BDCs. This is the primary reason BIZD's 10-year CAGR (9.73%) lags ARCC's standalone performance (13.57%) by nearly 4 percentage points per year.
| Profile | Value | Notes |
|---|---|---|
| Issuer | Franklin Templeton (Putnam) | Acquired and integrated in 2022 |
| Management style | Actively managed | No index tracking; portfolio manager selects holdings |
| Inception | September 29, 2022 | Only ~3.5 years of history |
| AUM | ~$250M | Much smaller than BIZD |
| Number of holdings | 24 | Concentrated; avoids weaker BDCs |
| Expense ratio (disclosed) | ~13.49% | Includes AFFE; direct cost ~0.60% |
| Distribution yield | ~11.2% | Slightly lower than BIZD |
| 3-year annualized return | ~10.0% | Limited track record |
PBDC Top Holdings: ARCC (11.65%), MAIN (8.89%), OBDC (8.79%), BXSL (8.11%), HTGC (8.04%) — a noticeably higher-quality lineup than BIZD, deliberately avoiding weaker BDCs like PSEC.
Advantage: Portfolio manager can actively exclude problem BDCs; 24 holdings means higher conviction and better quality control than BIZD's ~50.
Limitation: Smaller AUM ($250M vs $1.46B) means lower liquidity; direct expense rate (~0.60%) is higher than BIZD's (0.41%); only 3.5 years of history — insufficient to validate long-cycle performance; active management introduces stock selection risk. Most actively managed funds underperform their passive benchmarks over the long run — PBDC has not yet had enough time to prove otherwise.
| Dimension | BIZD (Passive) | PBDC (Active) | Direct Holdings (ARCC+HTGC) |
|---|---|---|---|
| Diversification | Highest (~50 BDCs) | Medium (24 BDCs) | Low (2–5 selected) |
| 10-yr CAGR (incl. dividends) | 9.73% | Only 3.5 yrs data | ARCC: 13.57% |
| Real extra cost vs. direct | +0.41% | +0.60% | +0% (no added cost) |
| Stock selection control | None (follows index) | None (fund manager decides) | Full control |
| Can avoid weak BDCs? | No (holds all) | Yes (active avoidance) | Completely |
| Covered Call strategy | Not viable (ETF shares) | Not viable | Yes — additional income |
| Portfolio Interest Exemption refund | Lower refund rate for ETFs | Same | Higher refund via IBKR |
| Research time required | Minimal (buy and hold) | Minimal | Quarterly earnings tracking |
| Minimum entry | 1 share (~$13) | 1 share (~$28) | Suggest 100 shares each |
| Best for | Beginners No research capacity | Want active selection without doing it yourself | Research-capable Maximizing return |
The Number That Explains Everything: 3.84% Per Year
ARCC 10-year CAGR 13.57% vs. BIZD 9.73% — a gap of 3.84% per year. On a $10,000 initial investment:
10 years in ARCC → approximately $35,600 (+256%)
10 years in BIZD → approximately $25,300 (+153%)
The difference is more than $10,000 — nearly equal to your original investment. This is the long-run compounding cost of "buy everything" versus "buy the best." The prerequisite, of course, is that you can consistently make good selection decisions — and are willing to invest the time to do so.
| Year | BIZD Annual Return | ARCC Annual Return | BIZD vs ARCC |
|---|---|---|---|
| 2016 | +12.1% | +14.9% | −2.8% |
| 2017 | +14.3% | +16.1% | −1.8% |
| 2018 | −5.8% | −2.1% | −3.7% |
| 2019 | +21.4% | +27.8% | −6.4% |
| 2020 | −11.2% | −4.1% | −7.1% |
| 2021 | +29.8% | +36.1% | −6.3% |
| 2022 | −6.5% | −3.8% | −2.7% |
| 2023 | +17.4% | +20.0% | −2.6% |
| 2024 | −3.8% | +19.8% | −23.6% |
| 2025 | −4.4% | +11.2% | −15.6% |
| 10-yr CAGR | 9.73% | 13.57% | −3.84%/yr |
The Fed's rate-cutting cycle compressed NII across the BDC sector. But the divergence came in credit quality: high-quality BDCs (ARCC) had spillover income buffers, strong shareholder trust, and resilient pricing. Weaker BDCs (PSEC and similar) repriced aggressively downward — and because BIZD holds them all, the drag was severe. Diversification in a stress environment sometimes means owning the worst along with the best.
Core (60–70%) → BIZD or ARCC as stable anchor
Satellite (30–40%) → HTGC, MAIN, PBDC for incremental yield
Under $3,000, no research time: BIZD. Participate in BDC market immediately. ~10% annualized.
$3,000–$10,000, willing to do some research: ARCC single holding. Target 13%+ CAGR.
Over $10,000, willing to track 2–3 names: ARCC anchor + HTGC satellite + Covered Call = 20%+ cash yield.
Absolutely no desire to research: BIZD. Accept 9.73% as the market return. An honest choice is always better than a pretend one.
The 12.86% affects underlying BDC management fees (AFFE) — but those are costs you'd bear anyway if you held the BDCs directly. They're just invisible, embedded in BDC share prices. BIZD charges you an extra 0.41% on top of what you'd pay holding individual BDCs.
The right question is: "Is 0.41% worth the diversification BIZD provides?" For most investors who aren't going to research individual BDCs, yes. For investors who can select high-quality names and avoid weak ones, probably not — because you're giving up 3.84%/year in return for that convenience.
Currently too early to say with confidence — PBDC has only 3.5 years of history and has not been tested through a full credit cycle. The premise of active management is that the portfolio manager will consistently outperform the index; the overwhelming statistical evidence says most active managers fail to do this over the long term.
PBDC's portfolio quality is genuinely higher than BIZD's (it deliberately avoids weaker BDCs), but whether the extra ~0.19% in direct fees generates sustained alpha will require 5–10 years of data to confirm. Reasonable option for investors who want "better than BIZD" without doing individual stock research — but don't expect it to beat direct holdings over a full cycle.
From a diversification standpoint, yes — BIZD holds ARCC (~19%) and HTGC (~6%). But three issues remain:
① Your ARCC exposure is only 19%; the other 81% includes many lower-quality BDCs you may not want.
② BIZD cannot support Covered Call strategies — ETF holders aren't direct shareholders of individual BDCs, so they cannot sell Call options against specific positions.
③ BIZD's dividend distributions have a lower "interest income" component ratio than directly held BDCs, making the Portfolio Interest Exemption tax refund via IBKR less effective.
BIZD is sufficient if you just want BDC market exposure. If you want precise allocation + options income, direct holdings are the better structure.
Yes — both BIZD and PBDC are listed on U.S. exchanges (BIZD on NYSE Arca, PBDC on NYSE Arca) and are fully accessible through IBKR and other U.S. brokerage accounts. No special account is required.
Tax note: ETF distributions are also subject to 30% U.S. withholding tax. However, the "interest income" component in ETF distributions is typically proportionally lower than in directly held BDC shares — so the Portfolio Interest Exemption refund via IBKR will be less favorable. The effective after-tax yield may be slightly lower than holding BDCs directly.
You can — but set realistic expectations. BIZD's long-term (10-year) annualized return of 9.73% is reasonable for a high-income asset class, but it meaningfully lags high-quality individual BDC selection (ARCC at 13.57%).
BIZD works as a core holding if: you want "bond-like high-yield exposure" without doing individual stock research, your capital base is smaller, or you simply prefer a passive approach. It's less appropriate if: you have research capability, want Covered Call income, or are optimizing for maximum cash flow return.
ETFs Are the Entry Ladder. Individual Stocks Are the Destination.
BIZD and PBDC are both legitimate BDC investment vehicles — but their primary value is lowering the research barrier for new investors entering the BDC market, not maximizing returns. The 12.86% headline expense ratio is a visual trap; the real incremental cost is 0.41%. The more meaningful long-run cost is the 3.84%/year return gap from "being forced to hold the weakest BDCs." If you can invest the time to understand ARCC's business model and HTGC's risk framework, direct holdings plus Covered Call is a structurally superior strategy. If you cannot or will not — BIZD's 9.73% annualized return is a respectable outcome. An honest choice always beats a pretend one.
- Published #1 BDC Overview: Complete Guide for Taiwan Investors
- Published #2 ARCC Deep Research: Moat, Resilience & 10-Year Track Record
- Published #3 HTGC Deep Research: Tech BDC Leader — High Returns, Real Risks, and the Man Behind It All
- This Article #4 BDC ETF Landscape: BIZD, PBDC & Decision Framework
- Advanced #5 BDC Covered Call: ARCC × HTGC Cash Flow Machine Complete Strategy
ProfitVision LAB · Shiba the Disciplined · "I teach you how to think, not just what to trade."


Comments ()