
Overture|Have You Ever Bought Travel Insurance?
Before boarding, you paid $12 at the airport kiosk for a travel insurance policy.
Somewhere, an actuary looked at your ticket and quietly ran the numbers: "The probability this flight has an incident is roughly 0.1%. Our maximum payout is $200,000. Expected loss: $200. You paid me $1,200. I just made $1,000."
You didn't lose — you bought peace of mind. The actuary didn't cheat you — she just sold you a low-probability promise and spread that risk across ten thousand other travelers.
Options sellers are that actuary.
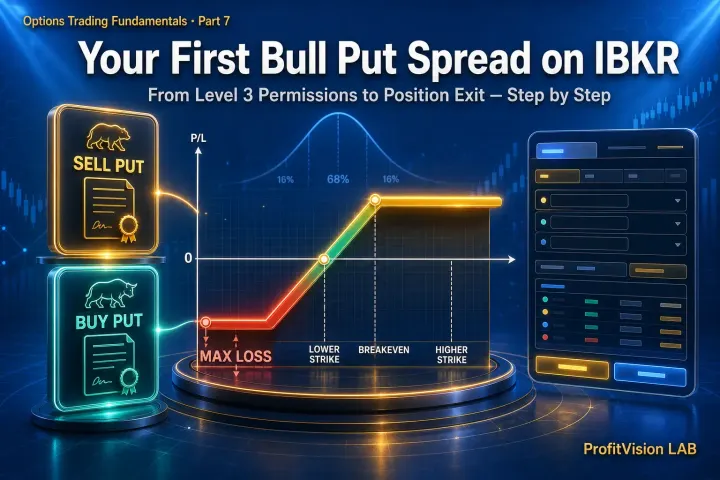
When you sell a Put, you tell the market: "I promise to buy shares at this price if the stock falls here." The buyer pays you a premium for that promise. You collect it, hold the position, and hope the bad outcome never materializes.
Now here's the question: what tools does that actuary use to manage risk?
Greeks.
Keep this framework in mind. Every chapter ahead translates the math into the language of an insurance actuary — because that's exactly what you are.
The Actuary's Language|Why Sellers Can't Ignore Greeks
Most options learners hit a wall when they encounter Greeks. Delta 0.5, Gamma 0.02, Theta -0.15 — these numbers look like a physics problem set. Most people skip them.
If you're a buyer, you can sometimes get away with ignoring Greeks. If you're a seller, you cannot. Greeks are your survival tools.
Imagine running an insurance company without knowing claim rates (Delta), without knowing how much daily revenue you earn as time passes (Theta), without knowing how storm seasons affect your pricing (Vega). You'd be flying blind. You'd be guessing.
The reason actuaries keep insurance companies profitable over decades isn't luck — it's this exact set of numbers. Claim probability drives premium pricing. Time decay drives daily revenue. Volatility seasons drive pricing adjustments. And they always know when to close a policy before the storm makes landfall.
You don't need to memorize formulas. You need to understand what each number is telling you. Greeks are your dashboard — not an exam. A pilot doesn't need to know the engineering specs of their altimeter; they just need to know what the reading means when it changes.
Delta (Δ)|What Are the Odds This Policy Gets Claimed?
Formally, Delta is the change in an option's price for every $1 move in the underlying. Calls have positive Delta (underlying rises → Call rises). Puts have negative Delta (underlying falls → Put rises in value).
For sellers, the more important meaning is this: Delta approximates the probability the option expires in-the-money — i.e., the probability you get assigned.
The Insurance Translation: Claim Probability
You sell a Put with Delta -0.25. In insurance language: this policy has roughly a 25% chance of being claimed (stock closes below your strike at expiration).
There's a 75% probability you do nothing, keep the full premium, and go home.
Delta 0.10 means a 10% claim rate — you're an extremely conservative underwriter, accepting only near-impossible-to-trigger policies. The premium is thin, but you almost never pay out.
Delta 0.50 means ATM — a coin flip. Maximum premium, but you're taking on substantial assignment risk. No serious seller wants to live here.
A seller doesn't sell options where the odds are fifty-fifty. — ProfitVision LAB Seller's Philosophy
The Seller's Sweet Spot: Delta 0.20–0.30
Most professional selling strategies target the Delta 0.20–0.30 band. Why? The premium is meaningful (unlike the wafer-thin payouts at 0.10), but the claim probability is low enough to generate consistent wins. This zone also happens to be where Theta decay efficiency is highest — two edges stacking simultaneously.
| Delta Range | Approx. Claim Probability | Premium Level | Theta Efficiency | Seller's Assessment |
|---|---|---|---|---|
| 0.05–0.15 | 5–15% | Very low | Low | Conservative, thin yield |
| 0.20–0.30 | 20–30% | Moderate | High | ✓ Seller's sweet spot |
| 0.35–0.45 | 35–45% | High | Moderate | Needs moat justification |
| 0.50 (ATM) | 50% | Maximum | Moderate | Sellers typically avoid |
Sellers Don't Use Delta for Direction Prediction
For Bull Put Spreads, Iron Condors, and Short Puts, your chosen Delta already defines your "no-loss zone." You're not predicting direction — you're asking: how far does the stock need to fall before I lose money?
A 0.25 Delta Put sits roughly two standard deviations below the current price. You're not guessing whether the stock goes up. You're confirming: "It would take an extreme move to reach my strike. The odds are with me."
Before selling any option, confirm Delta is between 0.20 and 0.30. Delta is your claim probability. If you're above 0.35, ask yourself: do I have compensating factors — very high IV, strong moat score, clear catalysts — that justify the added risk?
Theta (Θ)|Premium Depositing Into Your Account Every Day
Formally, Theta is the amount an option's value decreases by each passing day. For buyers, Theta is a relentless enemy — their option loses value whether the stock moves or not. For sellers, Theta is your daily paycheck.
Sell an option with Theta = -0.15, and that option loses $0.15 of time value every day. That $0.15 flows out of the buyer's account and into yours — automatically, without you lifting a finger.
The Insurance Translation: Daily Policy Decay
You sell a travel insurance policy in May for a flight departing in August. The premium is $120 because there's plenty of time for something to go wrong — storm season included.
But as each day passes, the "remaining window for a claim" shrinks. By late July, the flight is in two weeks. The dangerous uncertainty period is nearly over. The policy's remaining value collapses — because there's simply less time left for the insured risk to materialize.
That daily collapse is Theta. For you as the seller, Theta is the money silently arriving in your account every market session.
The stock doesn't need to rise. The market doesn't need to cooperate. Time alone works in your favor.
Theta Decay Is Not Linear — It Accelerates
This is one of the most important things new sellers get wrong: Theta doesn't decay at the same rate each day. It starts slowly, then accelerates sharply as expiration approaches.
Think of it like a block of ice melting. At room temperature, it melts slowly at first. But once it gets small enough, the surface-area-to-volume ratio changes, and it melts faster and faster. The last 20% disappears in a fraction of the time the first 80% took.
The DTE Sweet Spot: 45 to 21 Days
The most widely used framework among professional sellers: enter at 45 DTE (days to expiration), exit around 21 DTE.
At 45 DTE, Theta decay has begun accelerating while Gamma risk (the dangerous acceleration of Delta changes) is still manageable. You're in the most efficient time window for collecting premium.
At 21 DTE, you've typically captured 50–70% of the original premium. At this point, Gamma starts rising sharply. The actuary's move: close the policy, bank the profit, and remove the exposure. Leave the remaining 30% on the table. It's not worth the Gamma risk attached to it.
Entry window: 30–45 DTE. Theta accelerating, Gamma still contained.
Exit target: 50–75% of premium collected (typically 21 DTE or sooner).
Never do this: hold to the last week chasing the final few cents. Terminal Gamma can give back all your Theta gains in one session.
Theta Is Your Business Model, Not a Side Effect
Many sellers treat Theta as a passive side benefit. That's the wrong mental model.
Theta is the engine of the entire strategy. Your Delta selection determines how much premium you collect upfront. Your DTE selection determines how fast that premium decays toward zero. Engineer both parameters correctly, and Theta becomes a systematic cash flow machine — not a lucky bonus.
The actuary's first calculation: "How much premium am I collecting per day of risk exposure?" That ratio — daily Theta divided by maximum loss — is the core efficiency metric of every selling strategy.
Vega (ν)|Storm Season Makes Premiums Expensive
Formally, Vega measures how much an option's price changes for every 1% move in implied volatility (IV). Vega is always positive — higher IV means more expensive options, for both Calls and Puts.
For sellers, Vega cuts both ways: entering when IV is high means you're selling the most expensive premium available. But entering when IV is abnormally low means a subsequent spike can cause paper losses that dwarf your premium collected.
The Insurance Translation: Storm Season Pricing
In a calm winter, your insurance company sells travel policies for $80 each.
In August, when hurricanes are forming and everyone's nervous, the same policy costs $320. The potential for disaster is real, demand for protection is high, and you can charge accordingly.
That's exactly how IV works. When VIX spikes to 40 — when markets are genuinely afraid — options premiums explode. People are scrambling to buy protection. As the insurer (seller), you're the one collecting those panic-priced premiums.
Then the storm either hits or passes. The Fed statement comes out. Earnings are released. The uncertainty clears. Premiums immediately collapse — this is IV Crush. The policy you sold at peak fear is now worth a fraction. You buy it back cheap and pocket the difference.
IV Rank and IV Percentile: Your Storm Season Index
Raw IV numbers are meaningless without context. Tesla's IV at 50% might be historically low. A utility stock's IV at 25% might be at record highs. You need to know where current IV sits relative to history.
- IV Rank (IVR): "Where does today's IV rank between the 52-week high and low?" 100 = at the annual high, 0 = at the annual low.
- IV Percentile (IVP): "Of the past 252 trading days, what percentage had lower IV than today?" More robust — not distorted by a single outlier spike.
| IV Rank Range | Market Atmosphere | Premium Level | Seller's Strategy | Action |
|---|---|---|---|---|
| 0–20 | Clear skies, no wind | Minimal | Premium too thin; Vega reversal risk | Avoid selling |
| 20–40 | Light clouds forming | Below average | Conservative entry only, reduced size | Cautious entry |
| 40–70 | Weather turning | Moderate to high | Seller's sweet zone — premium is rich | ✓ Standard entry |
| 70–90 | Peak storm season | Very high | Excellent opportunity; pair with moat check | ✓ Add position |
| 90+ | Eye of the storm | Extreme | Assess: panic or structural breakdown? | Evaluate carefully |
IV Crush: Your Best Friend
Earnings announcements, Fed decisions, major product reveals — before any known event, the market inflates IV because nobody knows the outcome. The uncertainty premium gets priced in.
After the event, regardless of the news, that uncertainty is resolved. IV collapses immediately. This is IV Crush.
The actuary's playbook: sell the hurricane insurance during peak storm season (high IV). When the storm passes or turns (IV Crush), buy back the policy for a fraction of what you collected.
IV Crush is the seller's reward and the directional buyer's nightmare. Many new traders buy pre-earnings Calls or Puts, correctly predict the direction, and still lose money — because the IV collapse wiped out the gains from being right. This is why experienced sellers often say: buy direction before earnings, sell volatility after.
Vega Risk Management: Don't Sell Policies Mid-Hurricane
When IV Rank exceeds 90%, it means markets are in extreme fear. The premiums are extraordinary, but you must ask: Is this temporary panic, or is something fundamentally broken?
This is where the Four-Layer Defensive Screen's moat evaluation does its work. A company with a strong Five Moat Standards score — pricing power, switching costs, network effects, cost advantages, and regulatory moats all intact — won't be destroyed by temporary market panic. Selling into that high-IV environment against a fundamentally sound business is the actuary's best trade.
But if the company's moat is fragile, the market's fear may be well-founded. High IV alone is not permission to sell. High IV plus a strong moat is.
Gamma (Γ)|The Eye-of-the-Storm Accelerator
Formally, Gamma is the rate at which Delta changes as the underlying price moves. High Gamma means your position's Delta sensitivity is accelerating — every $1 move in the stock changes your risk profile faster than the last $1 did.
For sellers, Gamma is the Greek that can silently destroy a winning position in the final stretch.
The Insurance Translation: Eye-of-the-Storm Acceleration
When a hurricane first forms in the open ocean — 45 days before it might reach you — you have time. Time to track it, adjust your exposure, close some policies, reinforce others. Even if it shifts direction slightly, the impact changes gradually.
But once the eye wall is 200 miles offshore and accelerating — 7 days out — every hour matters. A 5-degree track change at this distance means the difference between a direct hit and a near miss. The damage potential is no longer changing slowly; it's accelerating exponentially.
That's Gamma.
Far from expiration, Gamma is low. Your Delta (claim probability) shifts only a little as the stock moves. You have time to react.
But when expiration is close AND the stock price is near your strike (ATM), Gamma explodes. A $1 move in the stock can send your Delta from 0.30 to 0.60 in minutes. Your claim probability can double before you can act.
Where Gamma Is Most Dangerous
Gamma reaches its peak when two conditions exist simultaneously:
- Close to expiration (within 7 DTE): time compression amplifies every price movement.
- Price near the strike (ATM): maximum uncertainty, maximum Delta sensitivity.
Both conditions together means the hurricane eye has made landfall. One bad headline, one sharp market move, and your position can swing from profitable to deeply painful in a single session.
Why 50–75% Profit Target Is Non-Negotiable
Now that you understand Gamma, the logic of the early exit rule becomes obvious.
Say you sold an option for $1.00. At 21 DTE, it's worth $0.35 — you're up $0.65 (65% profit). Should you hold to capture the final $0.35?
The calculation isn't just about the remaining profit. It's about the Gamma risk attached to that remaining profit. As you approach expiration with the stock near your strike, your risk per dollar of remaining premium increases dramatically. You're no longer being compensated adequately for the risk you're carrying.
Close the position. Bank the 65%. The remaining $0.35 isn't worth the Gamma you'd have to absorb to earn it.
Capital efficiency always beats single-trade maximization. The actuary who closes borderline policies early writes more policies in aggregate — and that's where the money is.
① Within 14 DTE, still holding positions where the stock is near your strike
② Into an earnings announcement, holding naked short options with elevated Gamma
③ Market drops 2%+ in a day and your Short Put is rapidly being pushed ITM
Rho and the Minor Greeks|Backup Gauges on the Dashboard
Beyond the four primary Greeks, the dashboard has secondary instruments. You don't watch these daily — but you need to know they exist and when they matter.
Rho (ρ) — Interest Rate Sensitivity
Rho measures how much an option's price changes when interest rates move by 1%. For short-dated selling strategies (30–45 DTE), Rho's effect is nearly zero. It only becomes meaningful for long-dated contracts (LEAPs — 9 to 12 months) where the discount rate has time to accumulate.
Insurance analogy: Rho is like the base interest rate's effect on insurance premium pricing. For a 30-day policy, irrelevant. For a 20-year life insurance policy, the actuary's interest rate assumption is everything.
For the standard seller operating in the 30–45 DTE window: Rho is a backup gauge, not a primary instrument. Know it exists. Move on.
Vanna — How IV Affects Delta
Vanna describes how Delta changes when IV moves. It explains a common post-earnings puzzler: "I was right on direction, but the position didn't profit as much as I expected." That gap is often Vanna in action — IV Crush simultaneously reduced Delta while you were making money directionally.
Charm — How Time Erodes Delta
Charm describes how Delta drifts as time passes. OTM options see their Delta gradually decrease toward zero as expiration approaches (they become less and less likely to be claimed). ITM options see Delta drift toward 1.0 (a near-certain claim). Understanding Charm helps explain why positions that seemed "safely" OTM last week are now closer than expected.
Primary dashboard (watch daily): Delta, Theta, Vega, Gamma
Understand, check around events: Rho (long-dated positions), Vanna (post-earnings IV Crush)
Advanced research (no rush): Charm, Volga, Vomma
The Actuary's Combat Dashboard|Full Workflow Greeks Checklist
Now we bring all four Greeks together into a practical, repeatable framework. Before you open a position, while you're holding it, and when you're deciding whether to exit — these are the questions to ask.
Greeks Combat Dashboard — Seller's Edition
All Four Greeks in One Sentence
Greeks and the Four-Layer Defensive Screen
You now understand Greeks. But Greeks are pricing tools, not stock selection tools.
An IV Rank 80, Delta 0.25, 35 DTE position looks perfect on the Greeks dashboard — but if the underlying company has a weak moat, institutional money flowing out, and the stock is trading below key technical support, you're selling a policy against a house on fire. The claim probability of 25% may be far too optimistic.
This is why ProfitVision LAB's Four-Layer Defensive Screen places Greeks as the final filter — not the first:
| Filter Layer | Core Question | Tool | Relationship to Greeks |
|---|---|---|---|
| Layer 1: Institutional Flow | Are institutions accumulating or distributing? | PV Institutional Flow Score | Validates your Delta direction assumption |
| Layer 2: Moat Quality | Five Moat Standards score ≥ 6? | Qualitative moat framework | Determines whether to hold through high-Gamma events |
| Layer 3: Volatility | IV Rank ≥ 40%? | IVR / IVP | Vega tool: confirms premium is worth selling |
| Layer 4: Technical | Stock above key support? Trend intact? | CANSLIM/SEPA Technical Framework | Confirms strike placement logic is sound |
Greeks tell you how to price and manage the position. The Four-Layer Defensive Screen tells you whether to take it at all. Together, they form the complete actuary's decision process.
Conclusion|You're Already a Junior Actuary
Go back to that airport insurance kiosk.
This time, you're not just the traveler buying the policy. You're beginning to see the calculation on the other side of the counter:
- Delta (claim probability) tells you whether to accept this risk and how much premium to charge
- Theta (daily decay) confirms that every passing day deposits more premium into your account
- Vega (IV Rank) determines whether you're pricing in storm season or clear skies — and whether the premium justifies the risk
- Gamma (eye-of-storm accelerator) decides when to close the policy before the hurricane makes landfall on your position
These four numbers don't require a math degree. They require a mental model — and you now have one.
Greeks transform "the market feels volatile" into "IV Rank is 75, Vega makes this entry attractive." They transform "I'm getting nervous about this position near expiration" into "DTE is 14 days, Gamma is rising, it's time to close." Intuitions become decisions. Feelings become frameworks.
If you haven't read The Complete Options Seller's Guide yet, that piece builds the full architecture — from stock selection and trade design to position sizing and exit discipline — where every one of these Greeks will reappear in context, as fluent instruments rather than abstract symbols.
Further Reading · The Complete Options Seller's Guide: A Probability-Based Framework for Sustainable Cash Flow
Further Reading · Bull Put Spread Playbook: Complete SOP from Design to Exit
Further Reading · The Four-Layer Defensive Screen: Why Not Every High-IV Opportunity Is Worth Taking


Comments ()