CANSLIM C+A Factor: EPS Acceleration Is the First Gate to Finding Superperformance Stocks
In stock research, there is a near-equivalent standard: EPS acceleration.
Like a lighthouse cutting through fog, it illuminates which companies among thousands are "rising with accelerating force."
William O'Neil's decades of historical research reached a consistent conclusion: the biggest winning stocks nearly always
displayed accelerating earnings momentum on the page before they made their massive price moves.
The numbers don't lie — but you have to know how to read them.
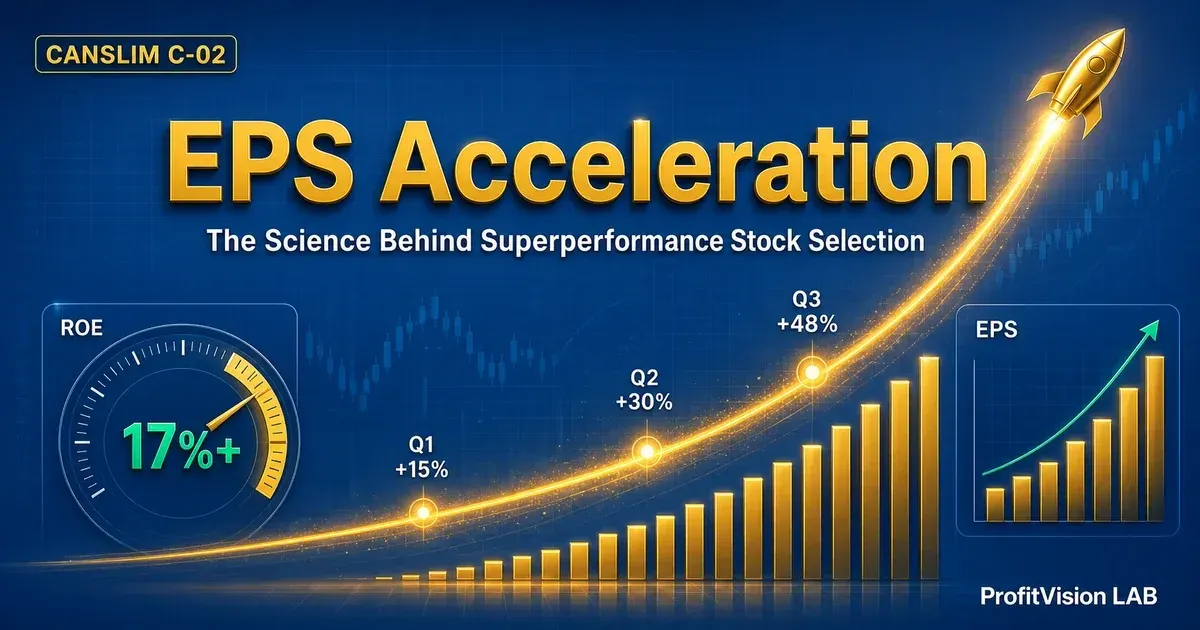
- C Factor (Current EPS): Latest quarterly EPS growth ≥25% year-over-year; an accelerating trend (prior quarter +15%, current quarter +30%) is even better
- A Factor (Annual EPS): Annual EPS growing ≥25% for 3+ consecutive years, with ROE ≥17% (indicating high-quality earnings)
- EPS acceleration is a "dual engine": it's not just about growth — it's about the growth rate itself rising, which signals true strength
- Post-Earnings Drift (PED): Stocks with strong earnings reports tend to continue drifting higher over the following 4–8 weeks, creating a "reaction window"
- The deeper meaning of ROE: 17% is not arbitrary — it represents the minimum threshold for a company's return on capital to outpace most passive investments
EPS Acceleration: Why 25% Growth Isn't Enough — "Acceleration" Is the Real Key
CANSLIM's C factor requires the latest quarterly EPS to grow ≥25% year-over-year. But O'Neil's research reveals a more nuanced signal: it's not just high growth rates, but stocks where the growth rate itself is accelerating that tend to become the ultimate big winners.
This analysis highlights an important principle: the EPS number itself is not enough — the direction of the EPS growth rate is the core of the judgment. A company accelerating from +15% to +48% signals that its business momentum is increasing — whether from market share gains, a new product breakout, or operating leverage all confirming in real time.
When a company performed poorly in the same quarter last year (such as posting a loss during COVID), even a mediocre current quarter can show massive EPS growth — a misleading illusion called the "Low Base Effect." The way to distinguish real from fake acceleration: examine the EPS trend over the past 4–6 quarters, not just the latest quarter's year-over-year figure. If growth was manufactured by a low base, the growth rate typically collapses as soon as that base period is lapped.
The Four Phases of the Business Cycle: Where Is Your Stock's EPS?
At the macro level, EPS acceleration and deceleration map onto a four-phase business cycle. Understanding which phase a stock occupies is a foundational tool for assessing position risk.
The A Factor in Depth: Annual EPS and ROE as a Dual Moat
The A factor requires not just annual EPS growth ≥25%, but also ROE (Return on Equity) ≥17%. Why must both conditions be met simultaneously?
Why ROE ≥17% Is the Quality Gatekeeper
ROE measures how much the company earns for every dollar of shareholder equity it employs. A company with ROE = 30% is compounding its shareholders' capital at 30% annually — this is the core of what Warren Buffett calls "the ability to reinvest capital at high rates."
| ROE Range | Implication | CANSLIM Assessment |
|---|---|---|
| < 10% | Low capital efficiency; may rely heavily on debt to sustain growth | Does not qualify (growth may be financial engineering) |
| 10–17% | Average; some moat but not exceptional | Borderline; needs support from other indicators |
| 17–30% | Quality business with genuine competitive advantage | Meets A factor requirement; fundamentally qualified |
| > 30% | Top-tier moat; the compounding machine Warren Buffett seeks | Strongly qualifies; EPS growth sustainability is higher |
Two companies can both post ROE = 25% through completely different means. A tech company might achieve it via high net margins (like Apple); a retailer via high asset turnover (like Costco); a bank via financial leverage (high risk). CANSLIM favors the first two — ROE supported by genuine business capability, not piled up through borrowing. When screening, pair ROE with debt-to-equity ratio: if ROE is high but debt ratio exceeds 80%, exercise extra caution.
Post-Earnings Drift (PED): The Hidden Opportunity After a Strong Report
Behavioral finance research has uncovered an interesting phenomenon: when a company reports earnings that far exceed market expectations, the stock price often doesn't immediately and fully reflect that good news — instead, it continues to drift moderately higher over the following 4–8 weeks. This is called "Post-Earnings Drift" (PED).
"The market is not an instant pricing machine, but a continuous process of revising expectations. A strong earnings report is a starting point, not an endpoint." — Behavioral Finance Research (Ball & Brown, 1968; Fama, 1998)
The root cause of PED lies in the "Conservative Revision Bias" of institutional analysts: when actual EPS significantly exceeds estimates, analysts' next-period forecasts remain conservative — they're reluctant to raise future projections all at once. The result: the probability of beating the next quarter's estimate remains elevated, pushing the stock to continue rising after earnings.
High-growth companies often operate in rapidly evolving markets — cloud software, electric vehicles, AI chips. Analyst valuation models rely primarily on historical data, making it objectively difficult to accurately forecast EPS 3 quarters out for fast-growing businesses. This "limited visibility" creates a persistent structural underestimation, turning each earnings report into a potential "beat." For investors, this is a structural opportunity to exploit — if you understand the company's growth logic earlier than the analysts do.
Challenging the C+A Factors: The Strongest Counterarguments
By the time earnings are released, the market already "knows" the past quarter's numbers. Smart institutions start building positions weeks before the report based on order data, supply chain intelligence, and CEO roadshow commentary. Acting on EPS acceleration only after the report is released means acting on the most delayed information available.
This criticism is partly valid. The EPS "number" is indeed backward-looking, but the EPS "acceleration trend" — especially consecutive acceleration over 3–4 quarters — is a repeatedly confirmed strength signal. PED research shows statistically positive returns persisting 4–8 weeks after earnings. More importantly, CANSLIM does not require buying on the day of the report; it waits for the stock to also form a technically actionable pattern in the weeks following — giving institutions time to complete their accumulation while retail enters the "second wave."
Companies can "manufacture" attractive EPS numbers through accounting maneuvers — adjusting non-cash charges, excluding one-time items, or reducing share count via buybacks. Selecting stocks based on EPS acceleration may mean being misled by financial engineering.
This is a legitimate concern, which is precisely why CANSLIM simultaneously requires "ROE ≥17%" and "stable annual EPS growth" rather than just a single quarter's figure. ROE measures capital efficiency and is difficult to sustain long-term through buybacks alone; the annual growth requirement filters out quarterly illusions created by one-time events. Additionally, SEPA's technical confirmation (institutional sponsorship, A/D Rating) provides a second validation layer — if earnings are fabricated, institutions won't keep buying to drive the stock price and A/D Rating higher.
Practical Application: Finding EPS Acceleration Candidates in Three Steps
Step 1 — Build the EPS Acceleration Filter
Set the following criteria in MarketSurge or another stock screening tool:
- Latest quarter EPS year-over-year growth ≥25%
- Prior quarter EPS year-over-year growth ≥15% (confirms accelerating trend)
- Annual EPS growth ≥25% for 3 consecutive years
- ROE ≥17% (filters out false growth from financial leverage)
Step 2 — Verify the "Quality" of Growth
After identifying candidates, confirm the following:
- Is growth driven by business expansion or a low base period? (Review EPS trend over past 4–6 quarters)
- Is gross margin stable or expanding? (Margin expansion = strengthening pricing power)
- Is free cash flow supporting EPS? (EPS not backed by cash flow = financial engineering suspicion)
Step 3 — Wait for the Post-Earnings "Confirmation Window"
After a strong earnings report, stocks typically have a 5–15 trading day "market reaction window." During this period:
- Watch whether the stock breaks out and holds higher ground on heavy volume (confirming PED effect is activated)
- If the stock drops sharply immediately after earnings, the market is rejecting it — hold off on entry
- If a new VCP pattern forms, wait for the SEPA entry trigger (see the E-02 article)
Some companies deliver a quarter that dramatically beats expectations due to a one-time event (land sale, litigation settlement, government subsidy), but this doesn't mean the business has truly accelerated. The identification method: review both "Adjusted EPS" and "GAAP EPS" — if the gap between them is large, dig into the reason. True EPS acceleration should show improvement in both figures.
A series of accelerating earnings reports is like a company sending investors a letter each quarter that keeps getting better — "Last quarter I earned X; this quarter I earned 1.3X; next quarter I expect to earn 1.6X." When the letter improves for three or four consecutive quarters, institutional capital starts to believe it reflects capability, not chance. Your job is to use SEPA's technical tools to make a precise entry right when "the market is just beginning to believe" and "before the mass chasing begins."
CANSLIM Foundational Series
C-01 CANSLIM Seven-Letter Overview| C-02 C+A EPS Acceleration (this article)| C-03 N+S New Catalysts & Supply Structure| C-04 L+I Leaders & Institutional Sponsorship| C-05 M Market Direction
- Confirm EPS year-over-year acceleration for 2–3 consecutive quarters (not a single-quarter spike)
- Gross margin and operating margin improving in tandem (not from one-time tax or expense items)
- Earnings beat + upward guidance revision ("beat & raise") — both present adds credibility
- Treating a single-quarter EPS spike as qualifying, ignoring the base effect
- Calling it "true acceleration" when GAAP earnings deteriorate but Adjusted EPS improves
- Treating ROE ≥17% as an iron law rather than a widely used quality reference threshold
- When the overall market enters a PE compression cycle (rising rate environment), strong earnings may not drive stock prices
- When an industry enters a downcycle, individual stock EPS acceleration may be a contrarian outlier
- When a stock's price fully reflects market expectations and the growth premium is already priced in
Comments ()