- Published #1 BDC Overview: Complete Guide for Taiwan Investors
- This Article #2 ARCC: America's Largest BDC Deep Research
- Coming #3 HTGC: Tech BDC Leader Deep Research
- Coming #4 BDC ETF Landscape: BIZD vs. Direct Holdings
- Advanced #5 BDC Covered Call: ARCC × HTGC Complete Strategy
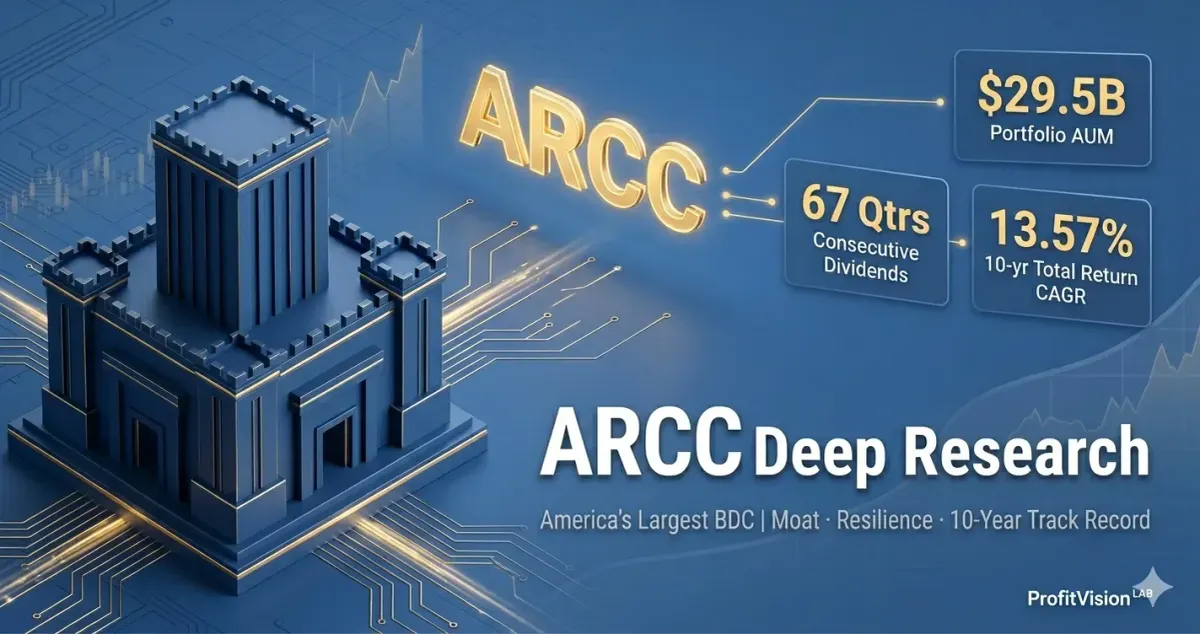
Ares Capital Corporation (NASDAQ: ARCC), founded in 2004, is the largest publicly traded BDC in the United States — and one of the very few institutions in private credit that has built a genuine competitive moat through sheer scale.
As of Q1 2026, ARCC's portfolio at fair value stands at $29.5 billion, spanning 607 borrower companies backed by 264 different private equity sponsors. That scale isn't just a number — it is the moat itself.
Why Scale Is a Moat in Private Credit
Middle-market lending is a relationship business. ARCC's parent, Ares Management, oversees $450+ billion in assets across private equity, real estate, infrastructure, and credit — maintaining long-standing relationships with hundreds of PE firms.
That means when a $100M lending opportunity surfaces, ARCC sees it earlier, moves faster, and can offer a complete financing solution from senior loans to equity. This deal flow advantage is structural and nearly impossible to replicate from scratch.
ARCC's record $15.8 billion in new commitments in 2025 is the clearest validation of this edge.
ARCC's model is straightforward: raise capital (equity + debt), deploy it as loans to mid-size private companies, collect the interest spread, and distribute the vast majority to shareholders.
| Investment Type | % of Portfolio (FV) | Characteristics |
|---|---|---|
| First Lien Senior Secured | ~55% | Highest priority claim in liquidation; lowest loss rate |
| Second Lien Senior Secured | ~12% | Second priority; higher rate, slightly higher risk |
| Unsecured / Subordinated Debt | ~8% | High yield; meaningful credit exposure |
| Preferred Equity / Equity | ~25% | Capital gains potential; higher volatility |
The First Lien-heavy structure is deliberately conservative: in a default scenario, ARCC sits at the top of the repayment waterfall. This structural priority is a primary reason ARCC's non-accrual rate has stayed low across multiple credit cycles.
72% of ARCC's debt investments are floating rate. During the 2022–23 rate hike cycle, NII and Core EPS surged. Since the Fed began cutting in 2024, NII has compressed — Core EPS fell from a peak of $0.59 (Q1 2024) to $0.47 (Q1 2026). This is a structural headwind, but the $0.48 dividend remains fully covered by Core EPS plus realized gains and spillover income buffers. The fundamentals have not deteriorated.
ARCC's target borrowers are private companies with annual EBITDA of $10M–$250M, typically PE-sponsored. The largest single sector is software (~25% of portfolio), with an average loan-to-value of just 37% and consistent EBITDA growth — one of the highest-quality pockets in the book.
ARCC's moat is real, but not unlimited. Blackstone, Apollo, and Blue Owl have entered private credit at massive scale, compressing lending spreads. ARCC's response is to compete on relationship depth rather than price — but over the long term, spread compression is a structural headwind worth monitoring through NII trends.
This chart answers the most common criticism of externally managed BDCs: that management dilutes shareholders. ARCC's NAV grew from $15.56 (2016) to $19.94 (2025) — a 28% increase over 10 years. The 2020 COVID dip was brief and fully recovered. The Q1 2026 decline is market-driven spread widening, not credit deterioration.
| Metric | Q1 2026 | Q4 2025 | Q1 2025 | Assessment |
|---|---|---|---|---|
| Core EPS | $0.47 | $0.51 | $0.55 | Rate pressure, still covers dividend |
| Quarterly Dividend | $0.48 | $0.48 | $0.48 | 67th consecutive stable quarter |
| NAV / Share | $19.59 | $19.94 | $19.94 | Market valuation loss, not credit |
| Leverage (D/E) | 1.10x | 1.12x | 1.05x | Well below 1.25x target ceiling |
| Non-Accrual (FV) | 1.2% | 1.2% | 1.4% | Low and stable |
| Available Liquidity | $6.0B | $6.0B | $5.5B | Ample |
| Dividend NII Coverage | ✅ Covered | ✅ Covered | ✅ Covered | High dividend safety |
Q1 2026 Core EPS of $0.47 appears to undershoot the $0.48 dividend at first glance. But management clarified: Core EPS $0.47 + net realized gains of $0.15 = $0.62 per share — far exceeding the $0.48 dividend. With $988M ($1.38/share) in spillover income available, ARCC has a multi-year dividend cushion that the current rate-cut environment alone cannot penetrate.
| Fee Component | Calculation Basis | Rate | Conflict Level |
|---|---|---|---|
| Base Management Fee | Total gross assets (incl. leverage) × 1.5% / yr | 1.5% | ⚠️ Moderate — incentive to grow asset base |
| Income Incentive Fee (Part I) | 20% of NII above 7% annualized hurdle rate | 20% | ✓ Reasonable — protected by hurdle rate |
| Capital Gains Incentive Fee (Part II) | 20% of cumulative net realized capital gains | 20% | ✓ Lookback mechanism prevents fee gaming |
The key protection: ARCC's Part II capital gains fee includes a "total return requirement" (lookback mechanism) — fees are only charged when cumulative realized gains exceed cumulative realized losses. This prevents the manager from collecting fees on paper gains while shareholders absorb real losses.
The base fee is calculated on total gross assets (not net assets), meaning at 1.1x leverage, the effective fee on NAV is approximately 3.2%. This is genuinely high — it's the clearest advantage internally managed BDCs like MAIN and CSWC hold over ARCC. However, 10 years of NAV appreciation from $15.56 to $19.94 proves that the Ares platform's deal flow and cost-of-capital advantages have more than offset this fee drag. Track record matters more than the rate sheet.
| Valuation Metric | Current | Historical Avg. | Interpretation |
|---|---|---|---|
| Share Price (May 2026) | ~$19.04 | — | ~97% of NAV |
| NAV / Share | $19.59 | ~$18.50 | Q1 2026 reported |
| Price / NAV | 0.97x | 0.93x | Near NAV, reasonable valuation |
| Annual Yield (on price) | 10.1% | 9.5% | Above historical average |
| P / Core EPS (annualized) | ~10x | ~10x | Fair, not expensive |
The April 28, 2026 earnings call was the first full quarter presentation under CEO Kort Schnabel. The tone: headwinds are real, but our position is stronger than any competitor's.
| Topic | Management Statement | Shiba the Disciplined's Read |
|---|---|---|
| Q1 Results | Core EPS $0.47 in a seasonally slow quarter; dividend fully covered including realized gains | ✓ In line, no surprises |
| NAV Decline | "More than two-thirds" from market-driven spread widening, not credit impairment | ✓ Mark-to-market, not fundamental |
| Q2 Outlook | Slow start expected to impact originations and exits; but deal flow picked up in late April | ⚠️ Q2 numbers likely soft, trend improving |
| Spread Improvement | Q2 backlog shows +35bps wider spreads, +40bps higher fees vs. Q1 | ✓ Better new loan terms; future NII supported |
| Liquidity | $6B available; no need to grow capital base | ✓ Conservative posture, waiting for opportunity |
| Spillover Income | $988M ($1.38/share) of taxable income available for 2026 distribution | Dividend cushion significantly strengthened |
Management said: "The current environment is reinforcing the advantages of scale, balance sheet strength, capital availability, underwriting discipline and portfolio management capabilities. We believe ARCC is navigating this period of market transition from a position of strength."
Translation: market volatility is a competitive advantage for ARCC, not a threat — because smaller lenders are constrained on capital and deal access, while ARCC's $6B in liquidity lets it cherry-pick the best opportunities in a dislocated market. This is exactly when scale moats show their value.
Non-accrual at amortized cost rose modestly to 2.1% from 1.8% the prior quarter (+30bps). Management attributed this to a small number of software portfolio reassessments. Fair value non-accrual held at 1.2%. Not a red flag at current levels, but requires monitoring over the next two quarters. The watch threshold is 3% at amortized cost.
| Year | Annual Total Return (DRIP) | Year-End NAV/Share | Annual Dividend/Share |
|---|---|---|---|
| 2016 | +14.9% | $15.56 | $1.52 |
| 2017 | +16.1% | $15.98 | $1.52 |
| 2018 | −2.1% | $16.10 | $1.52 |
| 2019 | +27.8% | $17.22 | $1.52 |
| 2020 | −4.1% | $15.13 | $1.40 |
| 2021 | +36.1% | $18.69 | $1.56 |
| 2022 | −3.8% | $19.48 | $1.68 |
| 2023 | +20.0% | $19.21 | $1.88 |
| 2024 | +19.8% | $19.82 | $1.92 |
| 2025 | +11.2% | $19.94 | $1.92 |
| 10-Year CAGR | +13.57% | $15.56 → $19.94 | $1.52 → $1.92 |
Seven positive years, three negative — with the worst drawdown only −4.1% (COVID 2020) and the best year +36.1% (2021). This asymmetry is core to the BDC income strategy: your downside is bounded, your upside compounds.
$10,000 Invested in ARCC 10 Years Ago
With dividends reinvested (DRIP), at a 13.57% CAGR:
$10,000 invested at the start of 2016 → approximately $35,600 by end of 2025 — a cumulative gain of +256%.
Over the same period, the S&P 500 with dividends returned approximately 13% CAGR. ARCC matches the index on a total return basis — but delivered it through high income, low price volatility. That's a fundamentally different risk profile, and for income-oriented investors, a more suitable one.
| Benchmark | 3-Yr CAGR | 5-Yr CAGR | 10-Yr CAGR |
|---|---|---|---|
| ARCC (dividends reinvested) | 13.41% | 14.44% | 13.57% |
| S&P 500 (with dividends) | ~14% | ~15% | ~13% |
| U.S. High Yield Bond ETF (HYG) | ~6% | ~5% | ~4% |
| ARCC vs. S&P 500 | Slightly below | Slightly below | Comparable |
At first glance, yes — Core EPS undershoot the dividend by $0.01. But that's only part of the picture. Management clarified: Core EPS $0.47 + net realized gains of $0.15 = $0.62 per share, more than covering the $0.48 payout.
More importantly, ARCC carries $988M ($1.38/share) in spillover income available for 2026 distribution. That's more than two full years of dividend reserves — the Fed's rate-cutting cycle alone cannot dent this. The dividend is safe. Short-term risk is low.
Nothing is wrong. Management explicitly stated that more than two-thirds of the NAV decline came from market-driven spread widening causing mark-to-market adjustments — not actual credit losses, and not borrowers failing to pay.
Think of it this way: ARCC's existing loans earn fixed or floating rates, but the market is now offering wider spreads on equivalent new loans — so the old loans look slightly less attractive on paper. As long as borrowers keep paying, this mark-to-market loss reverses over time. Non-accrual at fair value remained stable at 1.2%, confirming actual credit quality is sound.
Objectively, yes — fees are elevated. The base management fee of 1.5% on gross assets translates to roughly 3.2% of NAV at 1.1x leverage. Stacked with incentive fees, the total burden is meaningful.
But two factors make it defensible: First, 10 years of NAV growth from $15.56 to $19.94 proves the Ares platform generates enough alpha to cover fee drag — if management were diluting shareholders, NAV would shrink, not grow. Second, the Ares ecosystem's deal flow advantage and low cost of capital cannot be replicated by a standalone manager. If fee efficiency is your priority, internally managed MAIN or CSWC are better choices. If the track record is what you're paying for, ARCC is delivering.
This is a legitimate long-term risk management acknowledges. But several buffers exist: Blackstone and Apollo primarily target large-cap deals (EBITDA $500M+), while ARCC's sweet spot is $10M–$250M EBITDA. These markets overlap but aren't identical. More critically, ARCC's 264 PE sponsor relationships represent years of trust-building that isn't replicated overnight.
Management's Q1 call comment was revealing: market volatility reinforces ARCC's advantages, because in uncertain environments borrowers gravitate toward lenders with abundant liquidity and stable funding. ARCC's $6B war chest is a differentiator precisely when it matters most.
Three clear sell signals — any one of these warrants a serious reassessment:
① Non-accrual (amortized cost basis) consistently above 3%: This signals genuine credit deterioration, not market pricing. Currently at 2.1% — in the watch zone but not triggering.
② NAV/share declining more than 5% for three consecutive quarters: After filtering out market valuation adjustments, persistent NAV erosion may mean management is diluting shareholders or credit quality is structurally impaired.
③ Dividend cut announcement: If ARCC's board reduces the quarterly dividend, it means NII + spillover income combined can no longer support current payouts — the clearest signal of fundamental deterioration. None of these conditions are triggered today.
These terms appear frequently in ARCC's earnings reports and call transcripts. Understand them once; read every filing with clarity.
| Term | Definition | ARCC Current Value |
|---|---|---|
| NAV / Share Net Asset Value per Share |
Total assets minus total liabilities, divided by shares outstanding. The core BDC valuation anchor — analogous to book value. Price/NAV near 1.0 indicates fair valuation. | $19.59 Q1 2026 |
| NII / Core EPS Net Investment Income |
Real cash earnings per share from the lending portfolio, after management fees and interest expense. The primary dividend safety metric — should be ≥ quarterly dividend. | $0.47/qtr Q1 2026 |
| NII Coverage Ratio | NII ÷ quarterly dividend. Above 100% means the dividend is fully backed by real income. Below 100% means the BDC is paying from reserves — unsustainable long-term. | ≥100% incl. realized gains |
| Spillover Income | Cumulative undistributed taxable income carried forward. The BDC's dividend buffer — when NII compresses, management draws on spillover to maintain distributions without cutting. | $988M $1.38/share |
| Non-Accrual | Loans on which interest is no longer being accrued — the borrower is no longer servicing the debt. The clearest credit quality indicator. Watch threshold: >3% at amortized cost. | 2.1% (cost) 1.2% (fair value) |
| PIK Interest Payment-in-Kind |
Interest paid by adding to the loan balance rather than cash. BDC records income but receives no cash. High PIK ratios (>10%) signal borrower cash flow stress. | ~5% industry average |
| First Lien | Loans with the highest priority claim on assets in a default/liquidation scenario. Highest recovery rates, lowest risk. Quality BDCs hold First Lien as the largest portfolio component. | ~55% of portfolio |
| Leverage Ratio (D/E) | Total debt divided by stockholders' equity. BDC statutory ceiling is 2.0x (150% asset coverage ratio). Higher leverage amplifies both NII and losses. Healthy range: 1.0–1.5x. | 1.10x target <1.25x |
| SOFR Secured Overnight Financing Rate |
The U.S. dollar benchmark rate replacing LIBOR. BDC floating-rate loans are priced at "SOFR + spread." Fed rate hikes → SOFR rises → BDC income increases. Rate cuts compress it. | ~4.3% Q1 2026 |
| RIC Regulated Investment Company |
U.S. tax designation requiring distribution of 90%+ of taxable income to avoid corporate-level taxation. The legal foundation of BDC high yields — income passes through to shareholders untaxed at the entity level. | ✓ Qualified |
| Backlog | Investment commitments that have been verbally agreed but not yet formally closed or funded. A leading indicator of near-term origination activity. Subject to deal fall-through. | ~$1.8B as of Apr 23 |
| Lookback / Total Return Requirement | ARCC's capital gains incentive fee mechanism: fees are only charged when cumulative realized gains exceed cumulative realized losses since inception. Prevents the manager from collecting fees while shareholders absorb net losses. | ✓ ARCC has this |
ARCC: The Cornerstone Holding of the BDC World
ARCC is not a get-rich-quick position. It is a cash flow machine that makes time work for you. A 10-year CAGR of 13.57% matching the S&P 500 — delivered through high income and low price volatility rather than speculative appreciation. Real moat, steady NAV growth, 67 unbroken dividend quarters, $988M in spillover reserves. The Q1 2026 earnings call confirmed that widening spreads are actually improving future loan terms, positioning ARCC well for a market recovery. The sole item to monitor: non-accrual rising to 2.1% — watch for any sustained move above 3%. For income-focused strategies, ARCC is the primary candidate.
- Published #1 BDC Overview: Complete Guide for Taiwan Investors
- This Article #2 ARCC Deep Research: Moat, Resilience & 10-Year Track Record
- Coming #3 HTGC Deep Research: Tech BDC Leader, Supplemental Dividend & Risk Disclosure
- Coming #4 BDC ETF Landscape: BIZD vs. Direct Holdings Decision Framework
- Advanced #5 BDC Covered Call: ARCC × HTGC Complete Strategy (Margin & Cost-to-Zero Analysis)
ProfitVision LAB · Shiba the Disciplined · "I teach you how to think, not just what to trade."


Comments ()