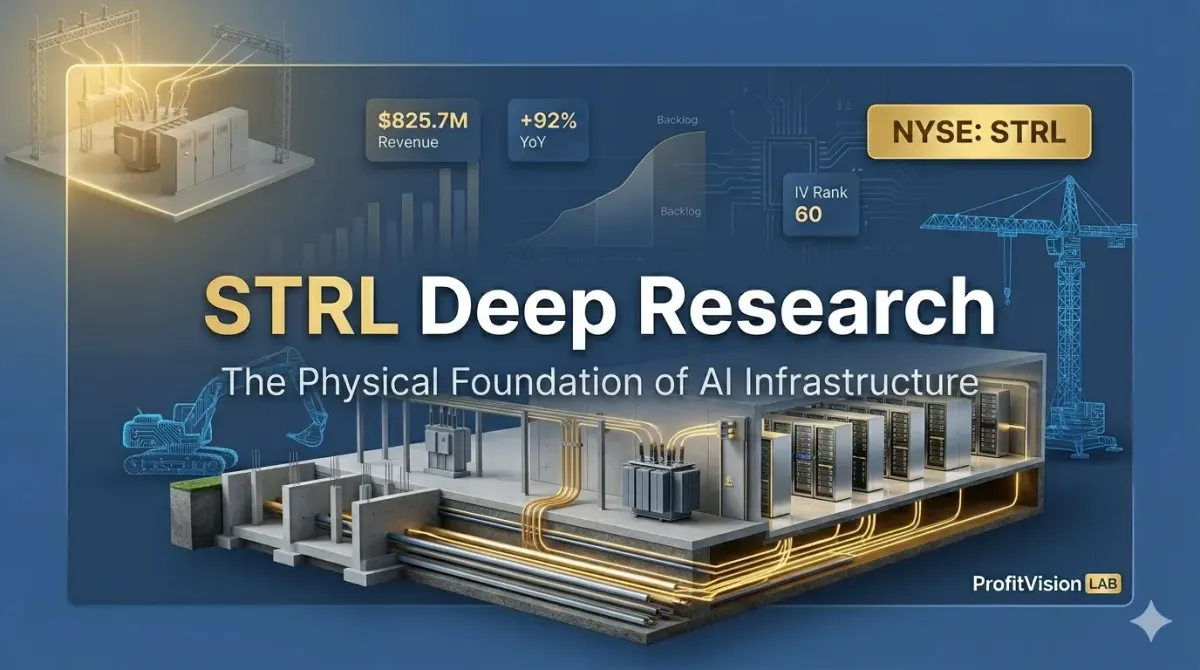
STRL Q1 2026 Deep Research: The Physical Foundation of AI Infrastructure
STRL is the purest AI infrastructure play in U.S. contracting. Q1 revenue hit $825.7M, 39% above consensus. Adjusted EPS of $3.59 beat estimates by 64%. All four filters of the Four-Filter Defense Screen pass. Bull Put Spread conditions confirmed with IV Rank at 60 post-earnings.
When the market chases GPUs, interconnects, and thermal solutions, who excavates the data center foundations and runs the power in?
| Metric | Actual | Consensus Est. | Beat |
|---|---|---|---|
| Revenue | $825.7M | $592M | +39% |
| Adjusted EPS | $3.59 | $2.19 | +64% |
| Adjusted EBITDA Margin | 20.2% | ~18% | +200 bps |
Four-Filter Defense Screen — Quick Reference
| Filter | Metric | Actual Data | Result |
|---|---|---|---|
| Filter 1: Institutional Flow | Relative Strength (YTD performance) | YTD ~+90%; after-hours +21% post-earnings | ✅ Pass |
| Filter 2: Economic Moat | Adj. EBITDA Margin / EPS Growth | 20.2% / Q1 adj. EPS +120% YoY; FY guide +72% | ✅ Pass |
| Filter 3: Volatility | IV Rank (post-earnings) | IV Rank = 60 (no crush post-earnings, elevated) | ✅ Pass |
| Filter 4: Technical | Price vs. 50-DMA | After-hours $644, well above 50-DMA | ✅ Pass |
🎯 Verdict: All four filters pass. Bullish coverage for equity; Bull Put Spread eligible — IV Rank 60 confirms favorable premium-selling environment.
Chapter 1: Industry Map — STRL as Layer 4 of the AI Infrastructure Narrative Chain
When the market discusses AI infrastructure, attention concentrates on three layers: compute (NVDA, AMD), interconnect and optical (ALAB, FN, Coherent), and power and cooling (VRT, Delta Electronics, Auras Tech). But before any of that equipment can be deployed, someone must grade the land, lay underground utility networks, and run medium-to-high voltage electrical systems from a substation to the machine room. That is exactly what STRL does.
The AI Infrastructure Narrative Chain: From Silicon to Concrete
There is a critical sequencing gap between Layer 4 and Layers 1–3: Layer 4 orders precede Layers 1–3 by 12–24 months. A 200MW hyperscale campus takes 40–60% of total project duration just on civil and electrical work before a single GPU can be racked. When a hyperscaler announces a new campus, contractors like STRL are typically among the first to receive purchase orders — ahead of NVDA's GPU shipments.
The inverse is equally important: when NVDA's order visibility deteriorates, STRL's backlog may signal a slowdown even earlier. This sequencing dynamic is essential to understanding STRL's valuation and cyclical risk profile.
Market Size and Growth Catalysts
The U.S. data center construction market was approximately $50B in 2024 and is projected to exceed $100B by 2028, implying a ~19% CAGR. Hyperscaler-owned campus construction now accounts for over 60% of the total and continues to grow — particularly favorable for contractors like STRL that can execute large-scale site development, as hyperscalers consistently pay a premium for execution certainty over unit price.
The second catalyst is domestic semiconductor fab reshoring. CHIPS Act-funded projects — TSMC Arizona, Intel Ohio, Samsung Taylor, Micron New York — each carry civil + electrical + mechanical budgets of $3–10B with multi-year timelines. STRL's Q1 2026 earnings call explicitly referenced securing the "initial phase of a large multi-year semiconductor fab site project," opening a second axis of growth alongside its historically data-center-dominant E-Infrastructure segment.
Chapter 2: Business Model & Economic Moat — Upgrading from Site Contractor to Civil + Electrical Integrator
Under CEO Joe Cutillo, who took the helm in 2017, STRL made a move that is highly atypical in construction: actively exiting low-margin commodity highway work and reallocating all resources toward mission-critical, high-complexity projects. This transformation reached its strategic apex in June 2025 with the $505M acquisition of CEC Facilities Group.
Three-Segment Revenue Structure (Q1 2026)
| Segment | Revenue | Mix | Adj. Operating Income | Adj. Margin | Focus |
|---|---|---|---|---|---|
| E-Infrastructure Solutions | $597.7M | 72% | $140.3M (+177% YoY) | 23.5% | Data center, semiconductor fab, industrial site civil + electrical |
| Transportation Solutions | $132.9M | 16% | $17.1M (+26% YoY) | 12.9% | Highways, bridges, airports (actively pruning low-margin work) |
| Building Solutions | $95.1M | 12% | $8.3M (-42% YoY) | 8.7% | Residential and commercial concrete foundations |
Three key observations emerge from this segment structure:
First, E-Infrastructure has evolved from the growth engine to the core of the business. In 2022, its revenue share was below 50%. It now stands at 72% ($597.7M, including $156.1M from CEC). Critically, its 23.5% adjusted operating margin is 2–3x the other segments — meaning STRL's overall earnings power ceiling is almost entirely determined by E-Infrastructure's trajectory.
Second, the Transportation segment's "active diet" is an underappreciated story. The market tends to view it as a low-margin cyclical drag. However, Cutillo began systematically exiting Texas low-bid highway work in 2024, redirecting resources toward higher-margin Rocky Mountain projects and alternative delivery contracts. Q1 Transportation revenue grew just 10%, but adjusted operating income grew 26% — clear evidence of deliberately choosing margin over volume.
Third, the Building Solutions residential foundation business will remain a headwind in 2026. U.S. housing affordability continues to deteriorate. Q1 adjusted operating income in this segment fell 42% ($8.3M vs. $14.2M prior year). This is STRL's only soft spot — but at 12% of revenue, the impact is manageable.
The CEC Acquisition: From Ground to Ground + Power
STRL closed its acquisition of CEC Facilities Group in September 2025 for total consideration of $505M ($450M cash + $55M stock + $80M earnout). CEC contributed $156.1M of standalone revenue in Q1 2026. Importantly, E-Infrastructure organic growth ex-CEC still reached +102% — meaning the core business was already accelerating sharply, and CEC layers additional momentum on top.
| CEC Acquisition Highlights | Details |
|---|---|
| Business | Specialized electrical and mechanical contracting for data centers and semiconductor fabs |
| Customer Mix | 80%+ mission-critical end markets; semiconductors are the largest single vertical |
| Q1 2026 Revenue Contribution | $156.1M |
| Est. 2025 EBITDA | $51–54M (~13% EBITDA margin) |
| EPS Accretion (2025) | +$0.63 to $0.70 per share |
| Leadership | Founder Ray Waddell retained to lead STRL's integrated electrical services platform expansion |
The CEC acquisition strengthens STRL's Economic Moat across three dimensions:
1. Cross-Trade Integration. Previously, STRL only handled site development (grading, underground utilities, foundations). Customers building data centers still needed to separately hire a specialty electrical contractor. Now STRL can deliver the full chain — site grading → underground utilities → medium/high-voltage switchgear → substation → facility electrical — as a single integrated package. For hyperscalers and fabs where schedule certainty outweighs unit price, this is a compelling proposition. The Q1 call confirmed two data center campuses already receiving both civil and electrical work simultaneously — early evidence of cross-selling materializing.
2. Entry into the Semiconductor Fab Market. CEC's 80%+ mission-critical exposure, with semiconductors as the largest vertical, fills the gap in STRL's own E-Infrastructure (historically 80%+ data center). STRL's Q1 win on a large multi-year semiconductor fab initial phase is this new axis coming to fruition.
3. Founder Retention as Integration Risk Mitigation. Ray Waddell's retention to lead the electrical services platform expansion is a materially positive integration signal. In specialty contracting, the most valuable assets are customer relationships and engineering talent. Founder retention signals that client relationships remain intact and key engineers are staying — reducing the risk of post-acquisition value destruction.
Moat Classification
STRL's Economic Moat is a compound of three types:
Cost Advantages (Scale): In the highly regional site development market, STRL holds scale advantages in corridors with high data center density: Rocky Mountain, Southeast, Texas, DFW. The per-unit cost of running five concurrent projects in a region is materially lower than for a competitor with one project.
Switching Costs: Hyperscaler and fab vendor qualification processes are lengthy (typically 12–24 months). Once on a preferred contractor list, renewal rates are extremely high. Post-CEC, STRL holds dual qualification status with both data center customers (Meta, Amazon, Google) and semiconductor customers (Intel, Micron, TSMC) — a credential profile that is very difficult for new entrants to replicate.
Intangible Assets (Execution Track Record): Mission-critical customers prize schedule certainty and safety records above all. These are built over a decade or more. STRL's accumulated execution record in data center site development, combined with CEC's semiconductor electrical credentials, constitute a trust capital stock that new entrants cannot shortcut.
- Customer Concentration Risk: E-Infrastructure backlog is 70%+ concentrated in a handful of hyperscalers. A repeat of Meta's 2022-style capex pullback from 1–2 key clients would materially compress backlog.
- Larger Peers Competing Downmarket: PWR and MTZ are several times STRL's scale. If they choose to aggressively price into site development work, STRL's margin advantage could compress.
- CEC Integration Execution Risk: Cross-trade integration synergies typically take 18–24 months to fully realize. Engineering handoffs, talent attrition, or customer resistance to bundled services could impair the integration premium.
Chapter 3: Competitive Landscape — Why STRL Is the Most Compelling of the Five U.S. Infrastructure Contractors
Among U.S. infrastructure contractors with AI data center exposure, five names stand out: PWR, MTZ, EME, STRL, and DY. Their scale, business mix, and AI exposure levels differ dramatically and cannot be assessed with a single framework.
Five U.S. Infrastructure Contractor Comparison
| Company | Market Cap | FY2025 Revenue | Primary Business | AI / Data Center Exposure |
|---|---|---|---|---|
| STRL | ~$20B | $2.5B | Data center site development + electrical; semiconductor fabs | Very High (E-Infra 70%+ of backlog) |
| PWR (Quanta) | ~$60B | $25B+ | Power T&D, renewable energy, communications | Moderate (data center power is one slice) |
| MTZ (MasTec) | ~$15B | $13B | Telecom, transmission, oil & gas pipelines, renewables | Moderate (data center power is one slice) |
| EME (EMCOR) | ~$25B | $15B+ | Mechanical, electrical, and plumbing (MEP); facility services | Moderate-High (data center MEP is a major vertical) |
| DY (Dycom) | ~$8B | $5B | Communications infrastructure, fiber deployment | Low (not a direct data center construction play) |
STRL's Differentiated Positioning
First, the highest AI exposure concentration. STRL's E-Infrastructure backlog is 90%+ mission-critical, with 72% of total revenues directly tied to data centers and semiconductor fabs. PWR and MTZ, while much larger, derive less than 20% of revenue from data center power. If your investment thesis is "direct exposure to AI capex spend," STRL offers the highest concentration.
Second, superior margin structure vs. large-cap peers. STRL's adjusted EBITDA margin exceeds 20%, versus ~9–10% for PWR, ~9% for MTZ, and ~9% for EME. STRL's margin premium reflects its deliberate strategy of pursuing fewer, higher-complexity projects rather than a broad diversified contractor model.
Third, valuation has not yet fully priced the transformation. STRL's forward P/E is approximately 34x, vs. PWR ~35x, MTZ ~28x, EME ~22x. But STRL's growth rate (Q1 revenue +92%, adj. EPS +120%) substantially exceeds peers, making its PEG ratio actually more attractive.
Chapter 4: Financial Resilience — Dual Test of Growth Velocity and Free Cash Flow Quality
Four-Year Revenue and Profitability Trajectory
| Metric | 2022 | 2023 | 2024 | 2025 | 2026E (Guidance Midpoint) |
|---|---|---|---|---|---|
| Revenue ($B) | 1.79 | 2.06 | 2.11 | 2.49 | 3.75 |
| YoY Growth | +39% | +15% | +2% | +18% | +51% |
| Adj. EBITDA ($M) | 185 | 261 | 328 | 504 | 858 |
| EBITDA Margin | 10.4% | 12.7% | 15.5% | 20.2% | 22.9% |
| Adjusted EPS | $3.45 | $5.18 | $6.10 | $10.88 | $18.73 |
| GAAP Diluted EPS (Guidance) | — | — | — | — | $16.50–17.15 |
Q1 2026 Key Financial Metrics
| Metric | Q1 2026 | Q1 2025 | Notes |
|---|---|---|---|
| Revenue | $825.7M | $430.9M | +92% (+55%+ organic) |
| GAAP Net Income | $96.0M | $39.4M | +143% |
| GAAP Diluted EPS | $3.09 | $1.28 | +141% |
| Adjusted EPS | $3.59 | $1.63 | +120%; consensus $2.19, beat +64% |
| Adjusted EBITDA | $166.6M | $80.5M | +107%; 20.2% margin |
| Cash & Equivalents | $511.9M | $638.6M | Partial CEC cash consideration paid in 2025 |
| Long-Term Debt | $272.3M | Low | Net cash position ~$240M |
| D/E Ratio | 0.23 | Low | Very modest leverage |
| Operating Cash Flow | $165.6M | $84.9M | +95% |
| Free Cash Flow | ~$146M | ~$67M | Capex ~$20M |
| Contracted Backlog | $3.80B | $2.13B | +78%; E-Infra organic +74% ex-CEC |
| Combined Backlog | $5.15B | $2.23B | +131% |
Full-Year 2026 Guidance (Raised)
| Metric | 2026 Guidance Range | Midpoint | vs. Prior Guidance |
|---|---|---|---|
| Revenue | $3.70B – $3.80B | $3.75B | Raised (consensus was ~$3.1B) |
| GAAP Net Income | $513M – $533M | $523M | Newly disclosed |
| GAAP Diluted EPS | $16.50 – $17.15 | $16.83 | Newly disclosed |
| Adjusted EBITDA | $843M – $873M | $858M | Raised |
| Adjusted EPS | $18.40 – $19.05 | $18.73 | Raised (consensus was $13.46; beat by 39%) |
- Accounts Receivable $513.9M: Roughly flat vs. year-end — reasonable relative to revenue growth.
- Contract Assets $131.7M: Up ~30% from year-end, reflecting a surge in work performed but not yet billed. Normal during a rapid-growth phase, but if this accelerates for 2–3 more quarters without converting to cash, it warrants attention.
- Contract Liabilities $695.6M: Customer advance payments, up 7% from year-start. This is constructive — it means clients have committed and paid deposits.
Chapter 5: Valuation & Scenario Analysis — The Debate Is Not "Expensive or Not" but "Will This Growth Continue Past 2027"
STRL surged +21.6% after hours to $644 following Q1 earnings, bringing YTD gains to approximately +90%. At the Q1 2026 adjusted EPS guidance midpoint of $18.73 and after-hours price of ~$644, the forward P/E is approximately 34x. This implies the market is currently pricing in a bull-leaning scenario — not extreme bull (35–40x), but above the base case (25–30x).
| Scenario | 2027 Assumptions | 2028 Assumptions | Implied Multiple | Implication |
|---|---|---|---|---|
| Bull Case | Revenue +25%, EPS +30% | Revenue +20%, EPS +25% | Forward P/E 35–40x | AI capex sustained; fab contracts phase in; CEC synergies fully realized |
| Base Case | Revenue +15%, EPS +18% | Revenue +10%, EPS +12% | Forward P/E 25–30x | AI capex moderates in 2027H2; EBITDA margins stabilize ~22% |
| Bear Case | Revenue +5%, EPS flat to -5% | Revenue -5% | Forward P/E 15–20x | AI capex peak passed; hyperscalers simultaneously cut; STRL re-rated as mid-cap construction |
Three Key Indicators for Assessing Growth Durability
Watch Point 1: CEC Integration Synergy Pace. Q1 showed two data center campuses receiving both civil and electrical work simultaneously. If Q2/Q3 expands this to 5–8 campuses, the "one-stop civil + electrical" thesis will be validated.
Watch Point 2: Semiconductor Fab Award Frequency. Q1 secured the first large multi-year fab project. If 1–2 additional comparable-scale awards appear in Q2/Q3, the semiconductor growth axis is confirmed.
Watch Point 3: Contracted Backlog Replenishment Rate. Q1 book-to-burn of 2.1x on contracted backlog. If Q2 and Q3 can sustain ≥1.5x, growth momentum extends into 2027.
Chapter 6: Conclusion & Tactical Positioning — Strong Equity Coverage; Options Bull Put Spread Eligible
Core Thesis (One Sentence)
STRL is the highest-concentration pure-play on AI infrastructure capex in the U.S. contractor universe; the CEC acquisition elevated it from a site contractor to a civil + electrical integrator and opened the semiconductor fab growth axis; Q1 earnings validated the thesis with a 39% revenue beat and 64% EPS beat vs. consensus; post-earnings IV Rank of 60 — with no IV crush — confirms all four filters pass, making both equity accumulation and options premium selling actionable.
Bull Case (Three Points)
- The Purest AI Infrastructure Layer 4 Play. Highest-concentration exposure in the space. Q1 earnings massive beat (revenue +39%, EPS +64% vs. consensus) validated the thesis.
- CEC Synergies Not Yet Fully Priced. Cross-trade selling has just begun (only 2 integrated campuses in Q1). The semiconductor fab growth axis just received its first major contract. The incremental runway remains substantial.
- Margin Structure Superior to Peers and Still Expanding. EBITDA margin has expanded from 10% to 23% over four years. FY2026 guidance implies further upward movement above 23%.
Bear Case (Three Points)
- AI Capex Peak Risk. STRL's backlog leads NVDA's GPU deliveries by 12–24 months — but the leading indicator works in reverse too. If hyperscalers simultaneously pull back in 2027H2, STRL's backlog warning will appear before chip stocks react.
- Customer Concentration. E-Infrastructure backlog is 70%+ from a handful of large customers. Capex changes at 1–2 clients directly hit the entire segment.
- Current Valuation Already Reflects Optimism. At 34x forward P/E for a mid-cap industrial, downside protection is limited if growth disappoints.
Options Positioning — Bull Put Spread Eligible
Update: Post-earnings IV Rank held at 60 with no IV crush. All four filters pass. Premium-selling conditions are confirmed. The absence of the typical post-earnings IV crush indicates the market retains meaningful uncertainty about the forward trajectory — a better-than-average environment for options sellers.
- Directional Bias: Moderately bullish / neutral — capturing time value premium via elevated IV Rank
- Short Put: Delta 25–28; strike approximately 10–12% OTM (at ~$644 reference, short strike ~$570–580)
- Long Put: Strike $10 below short put (~$560–570) to cap maximum loss
- DTE: 30–45 days to expiration
- Stop Loss: Buy to close if premium doubles (2x debit vs. initial credit)
- Profit Target: Consider closing at 50% of maximum credit received
Execution Note: After-hours gains of +21% may attract near-term profit-taking. Consider waiting for the next regular session to confirm price stability above the $620 support level before initiating, to avoid chasing an emotionally driven spike.
Upgrade / Downgrade Triggers
| Type | Trigger Event | Assessment |
|---|---|---|
| Upgrade to "Active Accumulation" | Q2/Q3 call confirms integrated campus count expands to 5+, and at least 1 new large semiconductor fab award | Growth durability confirmed; valuation converges toward bull scenario |
| Maintain "Research Coverage" | Q2/Q3 performance tracks guidance; book-to-burn ≥1.5x; IV Rank stays above 30 | Wait for opportunities to add options positions as IV confirms |
| Downgrade to "Pass" | Major client capex cut + book-to-burn below 1.0x + contract assets grow >20% for two consecutive quarters | Simultaneous growth and cash flow deterioration; multiple compression risk |
Coverage Log
| Date | Event | Judgment | Outcome |
|---|---|---|---|
| 2026/05/05 | Initial publication post-Q1 2026 earnings (revenue beat +39%, EPS beat +64%); IV Rank confirmed 60, all four filters pass | ✅ Equity: Active Coverage / ✅ Options: Bull Put Spread conditions met | — |
Next scheduled update: Post-Q2 2026 earnings (expected early August 2026).
Early update triggers:
- Any single-quarter semiconductor fab award exceeding $300M in new contract value
- Any major hyperscaler customer announcing significant 2027 capex adjustment (in either direction)
- Material CEC integration incident — key personnel departure or major client relationship loss
- Price breaks below the 50-day moving average accompanied by a backlog deterioration signal
Data Sources: Sterling Infrastructure Q1 2026 Earnings Press Release (PR Newswire), SEC 8-K Filing, StockAnalysis, StockStory, Company Public Disclosures.


Comments ()