- This Article #1 BDC Overview: Complete Primer
- Coming #2 ARCC: America's Largest BDC Deep Research
- Coming #3 HTGC: Tech BDC Leader Deep Research
- Coming #4 BDC ETF Landscape: BIZD vs. Direct Holdings
- Advanced #5 BDC Covered Call: ARCC × HTGC Cash Flow Machine
If you've invested in U.S. stocks for a while, you're probably familiar with REITs — they buy real estate, collect rent, and distribute that income to shareholders. BDCs follow almost identical logic, except the asset is corporate loans rather than property.
REIT: Acquires office buildings → collects rent from tenants → distributes rent to shareholders
BDC: Lends capital to mid-size companies → collects interest → distributes interest to shareholders
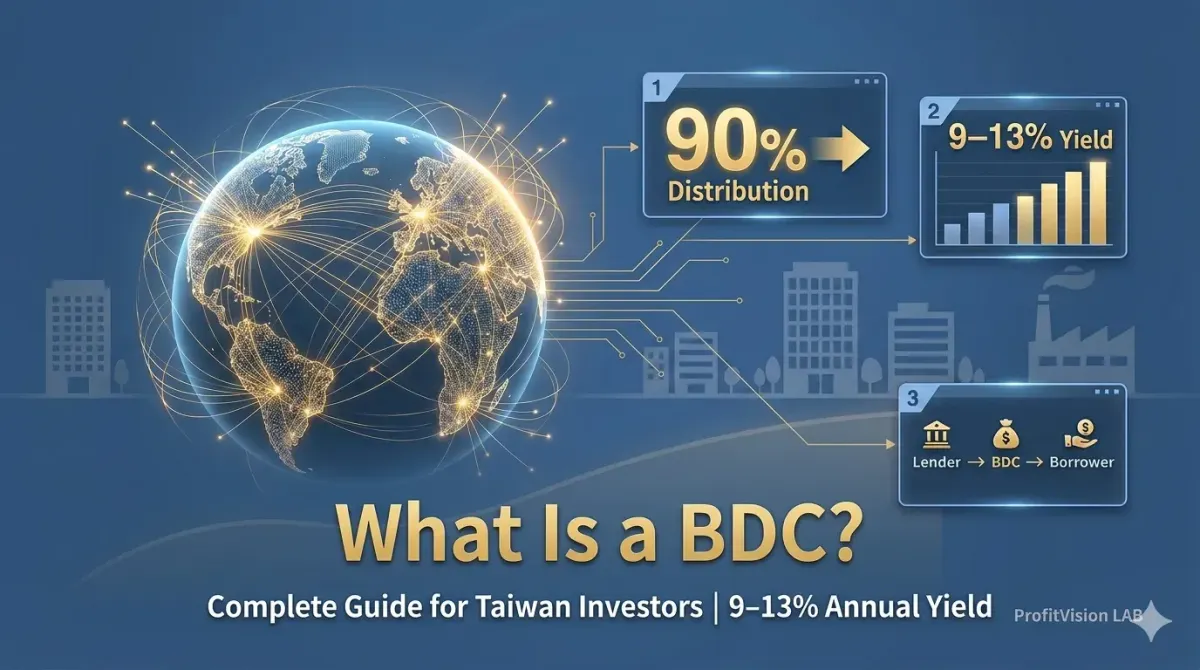
Both are legally required to distribute at least 90% of taxable income to shareholders — which is exactly why their yields are structurally far higher than ordinary stocks.
BDC stands for Business Development Company. The structure was created by the U.S. Congress in 1980 to solve a specific financing gap: mid-size American companies were too large for small business loans, yet too small to issue public bonds. BDCs were designed to fill that void as licensed lending intermediaries.
A BDC is a bank's corporate lending division, packaged as a publicly traded stock.
When you buy ARCC, you're effectively lending money to hundreds of American mid-market companies and collecting interest every quarter. The difference: a bank keeps those interest earnings for its own shareholders. A BDC is legally required to pass 90% of that income directly to you. No institutional investor status required. No connections needed. Minimum one share, same as buying TSMC ADR.
For Taiwan-based investors, BDCs are an unfamiliar asset class. But in terms of cash flow character, they're far closer to bonds than stocks — except their "interest" is paid as dividends, and the yield typically runs 10–12% annually.
The high yield isn't magic. It's a structural consequence of regulation. Three key legal requirements drive everything:
| Regulatory Requirement | Specifics | What It Means for Investors |
|---|---|---|
| RIC Tax Status | Must distribute at least 90% of taxable income annually | No corporate-level tax — avoids double taxation |
| Asset Concentration Rule | At least 70% of assets must be in U.S. small/mid-size businesses | Capital deployment is strictly constrained |
| Leverage Cap | Asset coverage ratio must be at least 150% (debt ≤ 2× net assets) | Leverage is legally limited — cannot over-borrow |
| Net Result | Nearly all profits must be paid out to shareholders | Structurally high yield — typically 9–13% |
Once a BDC qualifies as a Regulated Investment Company (RIC), it pays no corporate income tax as long as it distributes 90%+ of earnings. This is the same pass-through mechanism familiar from U.S. REITs — income flows directly to investors, who report it on their own returns. This is the structural reason BDCs can sustain yields that would be impossible for ordinary corporations.
One additional mechanism worth knowing: Spillover Income. BDCs don't have to distribute 100% of earnings in the year they're earned — the excess rolls forward. This buffer allows high-quality BDCs to maintain stable dividends during periods of temporarily compressed earnings, without immediately cutting distributions.
The BDC profit model is more diversified than it first appears. The core is spread income, but there's more:
You
Borrows + Issues equity
Borrowers
Quarterly dividends · High yield
| Income Source | Description | Est. Share |
|---|---|---|
| Floating-rate loan interest | Loans to mid-market companies, typically priced at SOFR + spread; moves with Fed rates | 70–80% |
| Origination & structuring fees | One-time fees charged to borrowers at loan closing | 10–15% |
| PIK interest | Payment-in-Kind: borrower pays interest with new debt, not cash (watch this carefully) | 5–10% |
| Equity upside | Warrants or equity stakes attached to loans; capital gains if the company grows | Variable |
BDCs lend at floating rates — a core structural feature. Rate hikes are favorable: every Fed rate increase raises loan rates, boosting Net Investment Income (NII) and dividend capacity. Rate cuts are headwinds: we are currently (2025–26) in a Fed easing cycle, compressing BDC interest income. This is a known, ongoing systemic pressure that must be factored into any current BDC analysis.
This is the distinction most investors overlook — and it's the most critical one. BDCs come in two management structures with very different levels of conflict of interest:
🏢 EXTERNALLY MANAGED BDC
- Investment team is "outsourced" to an independent asset manager
- Fee structure: management fee (% of AUM) + incentive fee
- Manager is incentivized to grow assets, not necessarily shareholder returns
- May dilute shareholders via below-NAV equity issuances to grow the fee base
- Examples: ARCC (Ares), HTGC (Hercules), FSK (KKR)
✅ INTERNALLY MANAGED BDC
- Investment team is directly employed by the BDC itself
- No external management fees; cost structure is more transparent
- Management compensation is more directly tied to company performance
- Typically more stable NAV growth and stronger dividend discipline
- Examples: MAIN (Main Street Capital), CSWC (Capital Southwest)
External managers charge fees based on asset size, not shareholder returns. This creates a powerful incentive to grow AUM through equity issuances — even at a discount to NAV — because it raises the fee base. Prospect Capital (PSEC) is a textbook negative case: years of dilutive equity raises eroded NAV persistently, forcing repeated dividend cuts. External management isn't automatically bad, but it demands stricter scrutiny: examine the fee structure, track NAV per share history, and verify NII coverage.
External management doesn't mean automatic failure. ARCC is managed by Ares Management, one of the world's top alternative asset firms; HTGC is run by Hercules Capital's own specialized tech-lending team with a strong multi-year track record. The key questions are whether management fees are reasonable, NAV per share is stable or growing, and dividends are backed by real NII. That's exactly what Series #2 and #3 will dissect.
NII Coverage Ratio ≥ 100%: Dividends are backed by real earnings, not financed by debt
NAV per share stable or growing: Management isn't diluting shareholders
Non-accrual ratio < 3%: Low proportion of loans no longer accruing interest
PIK ratio < 10%: Cash income proportion is healthy
Debt/Equity < 1.5×: Sufficient financial flexibility
| Asset Class | Yield Range | Dividend Stability | Price Volatility | Primary Risk |
|---|---|---|---|---|
| BDC | 9–13% | Medium-High | Medium | Credit cycle, rates, NAV dilution |
| U.S. REITs | 3–7% | High | Medium-High | Interest rates, property cycle |
| High-Yield Bond ETF | 5–8% | Medium | Low-Medium | Credit risk, interest rates |
| Preferred Stock ETF | 5–7% | High | Low | Rate sensitivity, liquidity |
| BDC Positioning | Sits between high-yield bonds and equities — a "private credit proxy" | Combines stock liquidity with bond-like income | ||
Within a portfolio, BDCs belong in the fixed income satellite allocation — not as a growth engine to replace equities, but as a cash flow machine generating stable income. A suggested allocation is no more than 10–20% of total equity holdings, to avoid over-concentration in a single credit cycle risk.
The good news: publicly traded BDCs are listed on NYSE or NASDAQ and trade exactly like any U.S. stock. IBKR, Firstrade, or brokerage sub-accounts all work — no special account required.
- Buy through IBKR or similar U.S. brokerage — minimum 1 share, no restrictions
- Dividends paid quarterly (some BDCs like MAIN pay monthly)
- U.S. withholds 30% dividend tax. Taiwan has no tax treaty with the U.S., so this cannot be reclaimed through Taiwan's tax authority. However, the interest-income portion of BDC distributions qualifies for the Portfolio Interest Exemption — IBKR handles this refund automatically, depositing it in January–February of the following year
- Keep your W-8BEN form current (valid 3 years; IBKR will remind you). Expired form = lost refund eligibility and possible backup withholding
- Covered Call selling is viable — BDCs' muted price behavior means OTM Calls rarely get assigned; premiums are stable quarterly income. Call premiums are not dividends — no withholding tax
- Non-traded BDCs: illiquid, no secondary market — not suitable for retail investors
- Private BDCs: institutional investors only — not accessible to retail
① Price / NAV: Near 1.0 or at a premium signals market trust in management; deep discounts (below 0.75) require investigation — distressed asset or genuine value?
② NII Coverage Ratio: Net Investment Income covering the dividend. Below 100% means the BDC is paying dividends from reserves — not sustainable.
③ NAV per Share — 10-Year Trend: Stable or growing NAV is the most reliable signal of management quality. Persistent NAV erosion, regardless of yield, is a warning sign.
An Industry That Has Grown Explosively
From 2020 to 2025, BDC industry AUM surged from approximately $127 billion to $451 billion — a 5-year CAGR exceeding 28%. There are now 156 BDCs in the U.S., with 50 publicly traded, representing approximately $159 billion in combined assets.
The structural driver: post-2008 banking regulation caused banks to retreat from mid-market lending, and BDCs filled that financing vacuum. This structural opportunity is not going away anytime soon.
| Headwind | Direction | Duration |
|---|---|---|
| Fed rate-cutting cycle | Floating-rate income compressed; NII under pressure | Ongoing 2025–26 |
| Private credit competition intensifying | Blackstone, Apollo, KKR competing for the same loans | Structural long-term trend |
| Mid-market default rates | Currently manageable; needs ongoing monitoring | Economic cycle dependent |
| Opportunity for quality BDCs | Prices partially reflect headwinds; valuations reasonable | Medium-to-long-term entry window |
Rate cuts are a headwind, not a death sentence. High-quality BDCs have Spillover Income buffers and the pricing power to maintain dividends through easing cycles. Choosing the right BDC matters more than timing the perfect entry.
Both banks and BDCs lend money, but three key differences set them apart:
① Different borrowers: Banks focus on large corporations and personal mortgages; BDCs specialize in mid-market private companies ($10M–$1B revenue) — a segment banks largely exited after 2008 regulation.
② Different income distribution: Banks can retain earnings and reinvest; BDCs are legally required to distribute 90%+ to shareholders, hence yields several times higher than bank dividends.
③ Different leverage limits: Banks can lever 10× or more; BDC regulation caps leverage at 2×, making the risk profile structurally more conservative.
Simply put: buying bank stock means owning the entire lending machine; buying a BDC means being a direct creditor to mid-market companies, collecting quarterly interest.
The high yield isn't a trap — but it has a price. BDCs lend to sub-investment-grade companies, taking on credit risk above that of ordinary corporate bonds. The 10–12% yield is compensation for that risk, not a free lunch.
The real trap is: chasing yield while ignoring NAV trends. Some BDCs pay 12% dividends while NAV erodes 5–8% annually — making real total return negative. Evaluate BDCs on both yield and NAV stability; neither metric is sufficient alone.
Both are dividend-focused, but the nature of the income is fundamentally different.
Taiwan high-dividend ETFs hold shares of listed Taiwanese companies; their dividends come from corporate earnings and are closely tied to the economic cycle and stock market performance.
BDC distributions come from corporate loan interest — closer to fixed income in character. Even during a broad stock market selloff, as long as borrowers continue servicing their loans, BDC income is not directly affected. That's why BDCs serve as a "bond-like satellite allocation" in a portfolio, not a substitute for Taiwan equities.
Yes — but high-quality BDCs have meaningful buffers.
BDCs can accumulate Spillover Income from prior years' over-earnings and deploy it to sustain dividends when current NII dips. This is why ARCC maintained its dividend through the 2020 COVID crisis while weaker BDCs cut immediately.
The key safety metric is the NII Coverage Ratio: above 110% means the dividend is well-covered; below 100% is a warning that the BDC may be paying dividends from reserves, which is unsustainable.
The U.S. withholds 30% dividend tax at source. Taiwan has no tax treaty with the United States, so this cannot be reclaimed through Taiwan's tax authority — the 30% is your baseline tax cost.
However, BDCs have an important exception: a portion of BDC distributions originates from corporate loan interest, which qualifies for the U.S. Portfolio Interest Exemption. This portion is legally refundable — and IBKR processes the refund automatically, no IRS filing required. The refund lands in your account in January–February of the following year. For ARCC and HTGC, the historical refund rate on distributions has been approximately 60–90%.
Note: Call option premiums are not classified as dividends — no withholding tax applies. Full amount received immediately.
Practical reminder: keep your W-8BEN form current (renew every 3 years; IBKR sends reminders). An expired W-8BEN means losing refund eligibility entirely.
It depends on how much time you want to spend on research:
Individual BDCs: You can select the highest-quality names and avoid weaker ones — typically better returns; but requires ongoing monitoring of each position's NAV trend, management fees, and portfolio quality.
BDC ETF (e.g., BIZD): Instant diversification across multiple BDCs in one trade; but fees layer on top of fees — the ETF's own expense ratio piles onto the underlying BDCs' management fees. You also inevitably hold some lower-quality names that drag on performance.
Series article #4 will provide a detailed comparison framework to help you decide. Stay tuned.
BDCs: Built for Disciplined Cash Flow Investors,
Not for Speculators Chasing Returns
BDCs are a structurally coherent, logically sound asset class. Their high yields are not free money — they are compensation for credit risk, liquidity discount, and management fees. Understand the mechanics clearly, and you can make a clear-eyed judgment: does this belong in your portfolio, how much, and which one. The next three articles in this series will dissect ARCC, HTGC, and BDC ETFs individually, so every choice comes with full visibility into its trade-offs.
- This Article #1 BDC Overview: Complete Primer
- Coming #2 ARCC Deep Research: America's Largest BDC, Moat & Valuation
- Coming #3 HTGC Deep Research: Tech BDC Leader, Supplemental Dividend Mechanics & Risks
- Coming #4 BDC ETF Landscape: BIZD vs. Direct Holdings Decision Framework
- Advanced #5 BDC Covered Call: ARCC × HTGC Complete Strategy (Margin & Cost-to-Zero Analysis)
ProfitVision LAB · Shiba the Disciplined · "I teach you how to think, not just what to trade."
Comments ()