ServiceNow 集中ポジション転換:Put → 株式 → Covered Call → LEAPS
ServiceNow(NOW)集中ポジション五段階の完全記録:裸売り Put で -$2,665 の失血、$128 の設計コストで株式転換、Covered Call でプレミアム収入、4 月に逆風下で 300 株まで買い増し、決算後に LEAPS CC を売り $5,247 を受領、保有コストを $98.78 から $81.28 へ圧縮。各意思決定の背後に明確な論理がある。
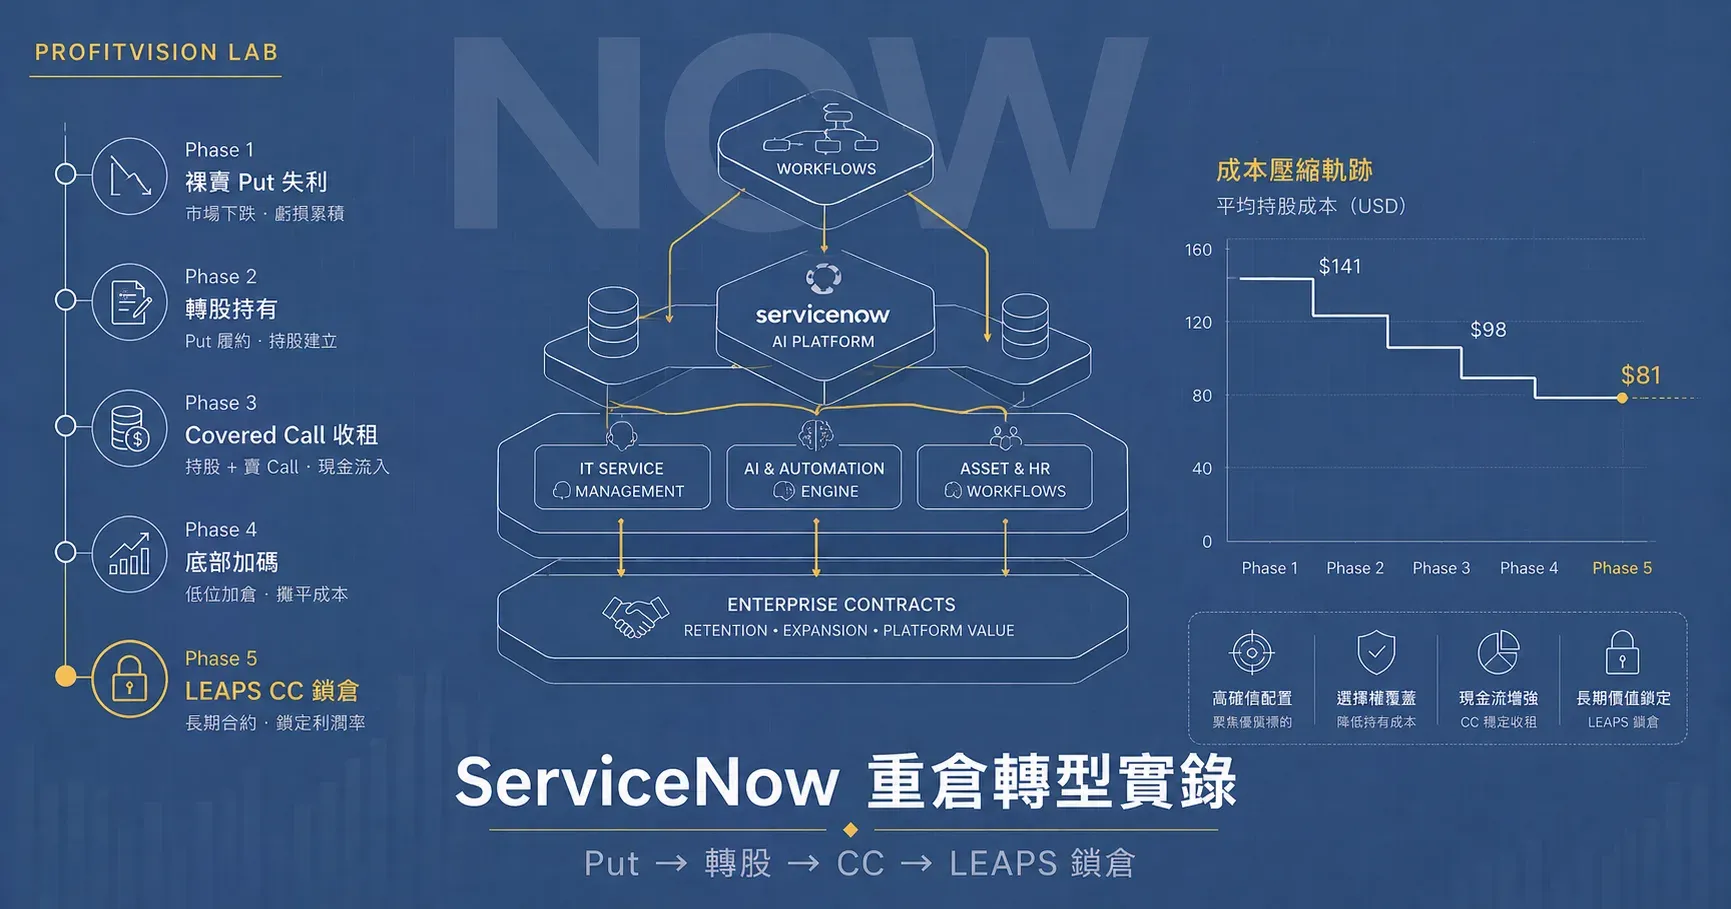
ServiceNow 集中ポジション転換の実録
Put 失血 → 株式転換 → Covered Call → LEAPS でロック
本稿が記録するのは、きれいな成功事例ではない。完全な「戦略の進化過程」——失敗から学び、市場の試練のなかで枠組みを調整し続け、最終的に多層のポジション管理システムを形にする過程である。
ServiceNow(NOW)はグローバル企業向け IT サービス管理のリーディング・ソフトウェア企業であり、経済的な堀は深いが、バリュエーションの弾力性が大きく、決算前後に急激な変動が起きやすい。私は 2026 年初にオプションを入口とし、五つの明確な段階を経て、最終的に「深掘り研究 + オプションによるコスト圧縮」を核とする集中ポジションの枠組みを築いた。(→ NOW 制度化ポジション構築フレームワーク v2.1)
📊 ServiceNow 決算の時点
Q4 FY2025 決算:約 2026 年 1 月 22 日 — 決算前後のオプション活動が異常に密集し、株価は $145 帯から $114 へ急落。この物語のトリガーである。
Q1 FY2026 決算:約 2026 年 4 月 23 日 — 大幅な買い増しの当日であり、LEAPS Covered Call を売って戦略をロックした時点でもある。
本稿が記録する多くの操作——逆風下の集中ポジション、急落中の大量買い増し——は外から見ると、規律違反の感情的な「落ちるナイフ掴み」に見えるかもしれない。だがこれらの意思決定には、読者には見えない背景がある:私は ServiceNow を七、八年追い続けている。決算を読むだけでなく、事業サイクル、経営陣の執行力、堀が年々どう深まるかを長期観察してきた。
この蓄積があるから、市場が最も恐慌しているときでも、「この会社はまだそこにいるか」について、定量では完全に言い切れない判断力を持てる。同じ論理は、私の CME、CBOE、IBKR での操作にも当てはまる——これらも長期に使い、深く追っている金融インフラ企業であり、研究するだけでなく、毎日そのプロダクトの中で生きている。
この前提がなければ、本稿が記録する多くの操作は複製すべきではない。 深掘り研究は集中ポジションの許可証であり、数本のレポートを読めば自動で得られるものではない。
五つの段階の進化
Q4 決算前、NOW 株は $145 付近で推移していた。私は 13FEB26 145P を売り、株価がこの水準を守れると判断した。決算後に株価は急落し、145P のプレミアムは $5.89 から $18 超へ跳ね上がった。1 月 8 日に二枚目を追加(@ $15.69)し、二枚合計で惨敗:
| 契約 | 売り | 買い戻し | 損益 |
|---|---|---|---|
| NOW 13FEB26 145P(一枚目) | $5.89 | $18.54(1/20) | -$1,265(手数料込) |
| NOW 13FEB26 145P(二枚目) | $15.69 | $29.66(1/29) | -$1,400(手数料込) |
| 二枚合計 | -$2,665 | ||
この転換を理解するには、もともとの戦略設計ロジックを先に押さえる必要がある:
NOW ポジションを建てる前、私は純粋なオプション投機ではなかった——むしろ 「Sell Put で予定コストの株式買い」 という戦略から入った:
145P を売り、合計約 $17 のプレミアムを受け取る
→ 満期で割り当てられた場合:実効取得コスト = $145 - $17 = $128
→ 割り当てられなければ:プレミアム全額を稼ぎ、次の機会を待つ
$128 がこの戦略の設計目標コストである。 決算後に株価が $114 へ急落し、もともとの「受動的な割り当てによる建玉計画」は強制的に前倒しされた。損失で Put を決済し、$114.87 で現物を能動的に買った——結果として、当初計画より低い建玉価格を手にした。
1 月 29 日、同日に三つの動作を完了した:
| 動作 | 詳細 | 金額 |
|---|---|---|
| 最後の 145P を決済 | $29.66 で買い戻し、損切りを確定 | -$2,966 |
| 現物 100 株を購入 | @$114.87(設計コスト $128 を下回る) | -$11,487 |
| 直ちに 13FEB26 130C を売却 | @$6.33、Covered Call を即起動 | +$633 |
1 月末の購入後、NOW は $114 から段階的に $121–$124 帯へ反発した。この期間、私は積極的に Covered Call を売り、複数回 Roll(旧契約の買い戻し + 新契約の売却)を行った:
| 契約 | 戦略 | 損益 | 説明 |
|---|---|---|---|
| NOW 13FEB26 130C | CC プレミアム | +$563.90 | 株価は $130 を超えず、全額受取 |
| NOW 06MAR26 115C | CC プレミアム | +$86.91 | 小利益で決済 |
| NOW 20MAR26 112C | CC ロール | +$207.60 | 二輪の操作合計 |
| NOW 20MAR26 130C | CC プレミアム | +$221.71 | 高い権利行使価格、無事満期 |
| NOW 06MAR26 120C | CC(やむなく Roll) | -$267.10 | 株価が $121 へ上昇、Roll が必要 |
| NOW 17APR26 110C | CC ロール | -$336.30 | 株価上昇で Call が値上がり、買い戻し |
2–3 月の CC 操作は多くが成功した。株価反発の速度が想定を超え Roll が必要になった局面もあったが、全体としてのプレミアム収入ロジックは明確である。
4 月初、市場はマクロ要因(関税/政策ショック)に打たれ、NOW は $124 から $84–$97 帯へ急落した。既に保有していた 100 株の含み損を前に、私は逆風下で大量に買い増した:
| 日付 | 購入数量 | 価格 | 累積保有 | 説明 |
|---|---|---|---|---|
| 4月8日 | +16 株 | $97.68 | 116 株 | 第一波の受け |
| 4月9日 | +24 株 | $90–92 | 140 株 | 買い増し継続 |
| 4月10日 | +60 株 | $84.78 | 200 株 | ⚡ 最大の単日買い増し、直近安値 |
| 4月22日 | +20 株 | $90.38 | 220 株 | 買い増しのリズムを維持 |
| 4月23日 | +80 株 | $85.04 | 300 株 | ⚡ Q1 決算日、建玉完了 |
買い増しの核心ロジック:ServiceNow の経済的な堀(企業 IT SaaS の粘着性、政府契約、AI Now プラットフォーム)は短期のマクロ・ショックでは変わらず、バリュエーションが妥当帯へ戻った——深掘り研究に支えられた買い場である。
4 月の大量買い増しには、もう一つの前提がある:Q1 決算(4 月 22 日)の前に、私は NOW 株の決算前の価格・出来高関係を仔細に観察していた。マクロ・ショック下で急落していても、$84–$85 付近では出来高を伴うサポートと、売り圧力の加速が見られないテクニカル形状が現れ、この水準に玉の受け止めがあることを示唆した。
ゆえにこの買い増しは、純粋な決算賭けではない——ファンダメンタル研究(堀が損なわれていない)× テクニカル確認(価格・出来高構造)の二重検証である。「あまり怖くない」のではなく、「怖くない理由がある」。 決算結果が出た後、サブスクリプション売上、EPS、RPO が軒並み予想を上回り、この判断の妥当性をさらに裏付けた。
📊 ServiceNow Q1 FY2026 決算結果(4 月 22 日引け後)↗
| 指標 | 実績値 | 市場予想 | 結果 |
|---|---|---|---|
| サブスクリプション売上 | $36.71 億 | $36.5 億 | ✅ 予想超過 |
| 総売上前年比 | 22% YoY | 19% | ✅ 予想超過 |
| 調整後 EPS | $0.97 | $0.96 | ✅ 予想超過 |
| RPO(未履行契約残高) | $277 億 | — | ✅ +23.5% YoY |
| 2026 通年サブスクリプション売上ガイダンス | $157.4–$157.8 億 | $155.5 億 | ✅ 上方修正 |
| AI 契約コミットメント(2026 年) | $15 億 | — | ✅ 実質的な成長 |
株価は翌日 14% 下落 —— 中東情勢(イラン紛争)により複数の中東大型契約の締結が延期され、市場はネガティブ信号を増幅し、予想超過のデータをすべて無視した。
決算の本質:事業は予想超過 + 地政学リスクが感情的な売りを誘発。
4 月 23 日の寄り付き、NOW は決算後の感情的な売りでさらに下落し、株価が前安値に近づいたところで最後の 80 株 @ $85.04 を買い、300 株の建玉を完了した——市場の過剰反応を利用した能動的な操作である。
同日、直ちに長期の LEAPS Covered Call を売った。決算後に LEAPS を売るには二層の論理がある:第一に、感情的な売りが IV(インプライドボラティリティ)を押し上げ、売却時により多くの時間価値を受け取れる;第二に、市場が悲観を続けても、LEAPS の長期性により時間減衰が毎日売り手のために働き続ける。
| 契約 | 権利行使価格 | 満期日 | 受取プレミアム | 状態 |
|---|---|---|---|---|
| NOW 17JUL26 85C | $85 | 2026/7/17 | +$935 | 保有中 |
| NOW 15JAN27 90C | $90 | 2027/1/15 | +$1,548 | 保有中 |
| NOW 21JAN28 85C | $85 | 2028/1/21 | +$2,764 | 保有中 |
| 合計(未実現) | +$5,247 | |||
LEAPS オプションの時間価値(Theta)は短期契約をはるかに上回る——満期が 2028 年の Call 一枚の絶対時間価値は一株あたり $27.64(一手 $2,764)に達する。LEAPS CC 売却の論理:
① 一度に大口プレミアムを受け取り、一株あたりの保有コストを $17–27 引き下げるに等しい
② 株価が $85 から $90+ へ戻り Call で割り当てられても、微益またはトントン(相対的に高コスト分の損失は縮小)
③ 株価が低位で膠着を続ければ、時間減衰は売り手に有利に働き続ける
これは「上方の値上がり余地を上限で封じる」ことを受け入れ、「確定的なキャッシュフロー」と交換する戦略的選択である。
現在ポジションの全貌
現物保有
| バッチ | 株数 | 平均単価 | 帳簿コスト | 説明 |
|---|---|---|---|---|
| 第一バッチ(4月安値) | 150 株 | $85.27 | $12,791 | 4/8–4/10 買い増し分 |
| 第二バッチ(より早い建玉) | 150 株 | $112.30 | $16,844 | 1–3月建玉分 |
| 合計 | 300 株 | $98.78 | $29,635 |
オープンのオプションポジション
| 契約 | 方向 | 権利行使価格 | 満期日 | 受取プレミアム |
|---|---|---|---|---|
| NOW 17JUL26 85C | 売り / Short | $85 | 2026/7/17 | +$935 |
| NOW 15JAN27 90C | 売り / Short | $90 | 2027/1/15 | +$1,548 |
| NOW 21JAN28 85C | 売り / Short | $85 | 2028/1/21 | +$2,764 |
LEAPS で受け取った $5,247 を算入すれば、一株あたりの帳簿コストは $98.78 から約 $81.28 へ圧縮され、低コスト分の水準に近づく。
戦略思考:これは計算問題ではなく、生存問題である
本稿が記録するのは「どれだけ正しく計算できたか」ではない。「各分岐点でどう考え、どの道具で持ちこたえたか」である。
決算後の急落に直面したとき、大半の人には二つの本能がある:損切りして退場するか、死守して動かないか。この戦略の核心は、第三の道を選ぶこと——道具の多様性で、自らの状況を能動的に変えることである。
最初の Put 売りは、NOW の方向に賭けることだった。決算後の急落で、その賭けは負けた。だが「誤りを認める」ことは「負けを認める」ことではない——真の転換は思考の切替である:
損失の出た Put ポジションを、「より高いコストで優良資産の所有権を得た」と再解釈する。その瞬間から、このポジションは「解決すべき損失」ではなく「経営すべき資産」になる。Covered Call はプレミアム収入、LEAPS は長期キャッシュフローのロック、買い増しは割安時に資産規模を拡大すること。一歩一歩が資産経営の意思決定である。
この戦略が生存できたのは、オプションと現物が相互に転換し、相互に補完できるからである:
株が下がった? Covered Call を売ってプレミアムを取り、時間を味方にする。
IV が急騰? LEAPS を売り、高額の時間価値をロックし、一度にコストを押し下げる。
Put がやむなく ITM? 株式転換し、「受動的な失血」を「能動的な建玉」に変える。
安値で買い増し? 現物を分割建玉し、ファンダメンタル確認と組み合わせる——盲目的な落ちるナイフ掴みではない。
これらの道具そのものは複雑ではない。複雑なのは正しいタイミングで正しい道具を選ぶことであり、それには自らのポジション、会社のファンダメンタル、市場構造を同時に明晰に認識している必要がある。
この戦略の境界はどこか?
この五段階戦略が成立するには、いくつかの前提条件がある:
① ファンダメンタルが集中ポジションを支えなければならない。 ServiceNow の継続サブスクリプション売上、AI Now エンタープライズ・スイートの浸透率、フリーキャッシュフローの健全性——これらが、$84 付近で大量に買い増す根拠である。深掘り研究がなければ、平均取得単価の引き下げは「下がるほど嵌まる」だけになる。
② LEAPS CC の上方上限は、本物の代償である。 もし NOW が 2028 年までに $120 超へ反発すれば、この LEAPS 負債は利益を制限する。これは明確なトレードオフ——上方余地の上限を受け入れ、いま確定する $5,247 のキャッシュフローと交換する。
③ 口座規模が集中ポジションの変動に耐えられなければならない。 300 株 × $85–$98 = 帳簿エクスポージャー $25,000–$29,000。このポジションの変動は小口座にとって圧力が極めて大きく、対応する全体のポジション管理ロジックが必要である。
📊 ServiceNow (NOW) v2.1 深掘り研究:価格決定権の防衛戦
📊 NOW Q1 FY26 決算解析:cRPO の跳ね vs Q2 guide のノイズ
📊 NOW 制度化ポジション構築フレームワーク v2.1:三段式方法論
📊 弱気相場ではまず生き残る:個人投資家でも実行できるリスク管理システム
ServiceNow Position Management:
Put Losses → Stock Conversion → Covered Calls → LEAPS
This is not a clean success story. It's a documented evolution — learning from an early mistake, rebuilding with a clearer framework, and ultimately constructing a multi-layer position management system around a high-conviction stock.
ServiceNow (NOW) is the global leader in enterprise IT service management software, with a deep moat in workflow automation and an expanding AI platform. Despite strong fundamentals, the stock carries a high valuation multiple that makes it susceptible to sharp selloffs around earnings and macro events. (→ NOW systematic position-building framework)
📊 Earnings Context ↗
Q4 FY2025 Earnings: ~January 22, 2026 — Heavy options activity in the days before. Stock declined from ~$145 to $114 — the trigger for the strategy reset.
Q1 FY2026 Earnings: ~April 23, 2026 — The same day as aggressive share accumulation and LEAPS covered call sales. The strategy's final chapter for this phase.
Some decisions recorded here — aggressive averaging down, concentrated positions at the lows — may look like undisciplined emotional catching of a falling knife. But there is a context readers can't see: I've been tracking ServiceNow for seven or eight years. Not just reading quarterly earnings, but watching its business cycles, management execution, and moat deepen year over year.
That accumulated understanding gives me a kind of conviction at peak market fear that's difficult to fully quantify. The same logic applies to my positions in CME, CBOE, and IBKR — financial market infrastructure companies I don't just research, but use every day as a practitioner. You understand a business differently when you live inside its product.
Without that foundation, many of the decisions in this article should not be replicated. Deep research is the license for concentration — and it isn't earned quickly.
Phase 1: Naked Short Puts Before Earnings — The Expensive Lesson
Before Q4 earnings, with NOW trading near $145, I sold the 13FEB26 145P at $5.89. After earnings disappointed and the stock fell sharply, I doubled down on January 15 at $15.69. Both positions closed at significant losses:
| Contract | Sold At | Closed At | P&L |
|---|---|---|---|
| NOW 13FEB26 145P (Leg 1) | $5.89 | $18.54 (Jan 20) | ~-$1,265 |
| NOW 13FEB26 145P (Leg 2) | $15.69 | $29.66 (Jan 29) | ~-$1,400 |
| Total | -$2,665 | ||
Selling naked puts into earnings is precisely the wrong setup for an options seller: earnings are Gamma events where a 10% overnight move eliminates all theta advantage and turns Delta into the dominant P&L driver.
Phase 2: The Pivot — From a $128 Target Cost to Stock Ownership
Before understanding January 29, it's important to understand the original intent: the short put was not speculation — it was a planned stock acquisition at $128.
The design: sell the 145P, collect ~$17 in premium, resulting in an effective purchase price of $145 - $17 = $128 if assigned. When the stock fell sharply through $145 post-earnings, the planned assignment became an emergency exit. Closing the puts at a loss and immediately buying shares at $114.87 was not abandoning the strategy — it was executing the stock acquisition at an even better price than the $128 target, accepting the options loss as the cost of the failed execution path.
On January 29, three things happened simultaneously: closed the final 145P at $29.66 (-$2,966), bought 100 shares at $114.87, and immediately sold the 13FEB26 130C at $6.33. The covered call era began that morning.
True cost basis accounting: Including the put losses (-$2,665), the effective cost per share on the initial 100-share position was approximately $141.52 — above the $128 target, but recoverable through systematic covered call writing.
Phase 3: Covered Call Income — Stock Rebounds from $114 to $124
February and March saw NOW recover from $114 to $121–124. I systematically rolled covered calls through this period, capturing time decay across multiple contracts. Best performer: NOW 13FEB26 130C at +$563.90, as the stock didn't reach $130 and the full premium was collected. Several calls required rolling as the stock moved up faster than expected, but the overall CC framework generated meaningful income during the recovery phase.
Phase 4: April Macro Selloff — Aggressive Averaging Down
In early April, macro headwinds (likely tariff-related policy uncertainty) drove NOW from $124 back down to the $84–97 range. This is where fundamental conviction translates into action:
| Date | Shares Added | Price | Cumulative |
|---|---|---|---|
| Apr 8 | +16 | $97.68 | 116 shares |
| Apr 9 | +24 | $90–92 | 140 shares |
| Apr 10 ⚡ | +60 | $84.78 | 200 shares |
| Apr 22 | +20 | $90.38 | 220 shares |
| Apr 23 ⚡ | +80 | $85.04 | 300 shares |
The April 10 purchase of 60 shares at $84.78 represents the tactical low — maximum conviction at maximum fear. The position is now split: 150 shares at a ~$85 average (April tranche) and 150 shares at ~$112 average (earlier tranche).
The aggressive April accumulation wasn't blind averaging down. Before Q1 earnings on April 22, I was closely tracking NOW's pre-earnings price and volume dynamics. Despite the macro-driven selloff, the $84–$85 area showed high-volume support without any acceleration of selling pressure — a technical signature suggesting institutional accumulation at those levels.
This created a double-confirmation framework: fundamental conviction (ServiceNow's moat intact) reinforced by technical structure (price holding on volume). The April buying wasn't fearless — it was informed. When Q1 earnings came in with beats across every key metric, the thesis was validated. The -14% post-earnings drop on the Iran headline was market noise over a fundamentally strong quarter — exactly the kind of dislocation this entire strategy was designed to capitalize on.
Phase 5: Q1 Earnings Drop — Buy the Panic, Sell the IV
📊 ServiceNow Q1 FY2026 Earnings (April 22, After Market Close)
Every key metric beat estimates: subscription revenue +22% YoY to $3.67B (beat), adjusted EPS $0.97 vs $0.96 expected (beat), RPO $27.7B growing 23.5% YoY (beat), full-year guidance raised to $15.74–15.78B. AI-specific contract commitments reached $1.5B for 2026.
The stock dropped 14% on April 23 — driven by disclosure of headwinds from delayed large on-premise deals in the Middle East due to the ongoing Iran conflict. The market amplified one line item into a narrative of demand destruction, ignoring every other beat.
The verdict: a fundamentally strong quarter, punished by geopolitical noise.
On April 23, I bought 80 shares at $85.04 into the post-earnings selloff, completing the 300-share position. Then sold three LEAPS covered calls the same morning — deliberately timing the LEAPS sale to the earnings-elevated IV environment, maximizing the premium received.
The LEAPS covered calls sold on April 23 collected structurally higher premiums precisely because earnings-day implied volatility was inflated. Within days, as the IV crush sets in, the value of those short calls declines — an immediate paper gain for the seller.
| Contract | Strike | Expiry | Premium |
|---|---|---|---|
| NOW 17JUL26 85C | $85 | Jul 2026 | +$935 |
| NOW 15JAN27 90C | $90 | Jan 2027 | +$1,548 |
| NOW 21JAN28 85C | $85 | Jan 2028 | +$2,764 |
| Total LEAPS Premium | +$5,247 | ||
With $5,247 in LEAPS premium received, the effective cost basis on the 300-share position drops from $98.78 to approximately $81.28 per share — close to the April low tranche's cost.
The Real Lesson: This Is a Survival Problem, Not a Math Problem
This article is not a record of how well the numbers worked out. It's a record of how to think — how to survive in a market that moves faster and harder than any model predicts, and how to use the flexibility between options and stock to stay in the game long enough for fundamentals to matter.
Most traders facing a post-earnings drop do one of two things: cut the loss and walk away, or freeze and hope. This strategy chose a third path: use the toolkit's versatility to actively reshape the position.
Selling that initial put was a directional bet on NOW staying above $145. That bet was wrong. But admitting the error didn't mean accepting the loss as the final outcome — it meant changing the frame entirely.
The moment you reframe a losing options position as "I've acquired a stake in a quality asset at a higher-than-ideal cost," everything that follows changes. Covered calls become rent collection. Adding shares at $84 becomes expanding ownership at a discount. Selling LEAPS becomes securing future cash flow. The loss becomes a starting point, not an ending.
Stock falling? Sell covered calls. Let time decay work while you wait.
Implied volatility spiking? Sell LEAPS. Lock in premium at peak fear pricing.
Put going deep ITM? Convert to stock. Turn passive bleeding into deliberate ownership.
Price at generational lows? Add shares in tranches, anchored to fundamental conviction.
None of these tools is complicated in isolation. What's difficult is knowing which tool fits which moment — and having the discipline to switch between them without letting emotion override the framework.
Key Lessons from the NOW Journey
① Don't sell naked puts before earnings — that's a Gamma event, not a theta event. Wait for earnings to pass before establishing positions.
② When a short put goes deep ITM, convert to stock — the put already has a Delta near -1, which means you're already long the stock in economic terms. Converting locks the entry price and activates the covered call income mechanism.
③ Averaging down requires fundamental conviction, not hope — the April accumulation only makes sense because ServiceNow's moat (enterprise contract stickiness, government integrations, AI Now platform) remained intact despite the macro selloff.
④ LEAPS covered calls are a structural tool, not a trade — selling $27/share in time value on a 2028 LEAPS is not about predicting the stock's price by then. It's about mathematically compressing your cost basis by accepting a defined ceiling on your upside.