M-02 Confirmation Signals & Violation Signals: The Two-Sided Mirror of Position Management
Learn SEPA confirmation signals and violation signals for post-entry position management: how to use price-volume behavior, support levels, time stops, and pyramiding confirmations to decide when to add, hold, reduce, or exit.
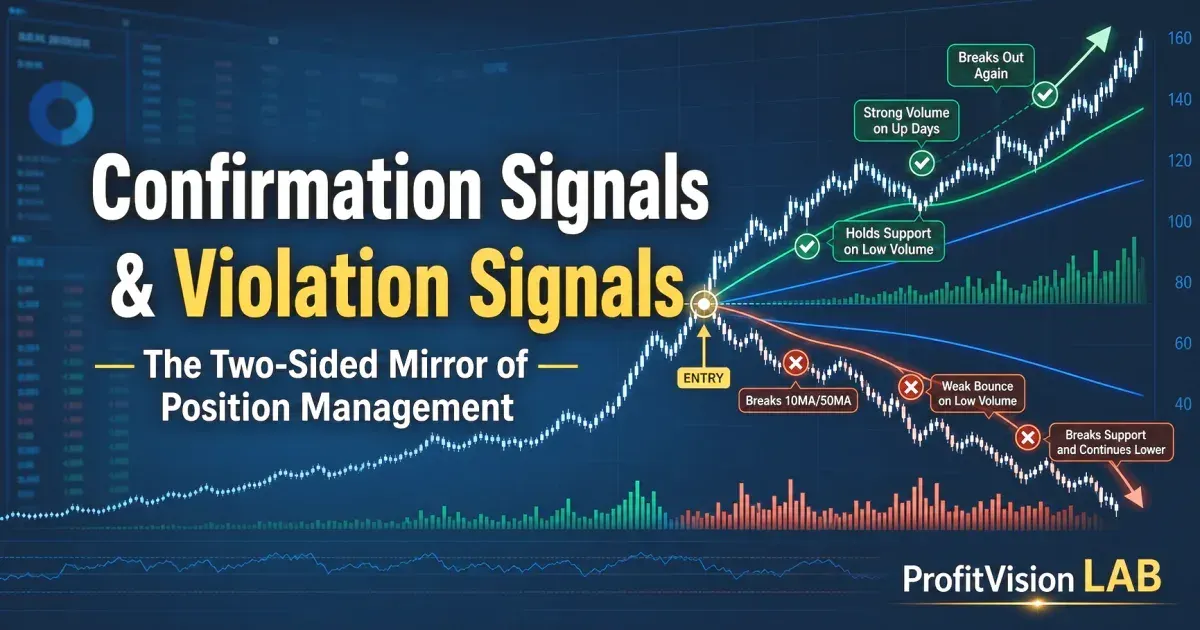
- After entry, you are not "waiting" — you are continuously receiving market feedback. Confirmation signals tell you to add to the position; violation signals tell you to exit.
- Confirmation signals: closing near the day's high, low-volume pullbacks, repeatedly holding support — all indicate institutional accumulation.
- Violation signals: breaking key moving averages (10-day / 50-day), large-volume closes at the low, failed retests — all indicate institutions are leaving.
- Time stop: if 3–4 weeks pass after entry with no meaningful price progress, that itself is a violation signal because the breakout has not gained institutional sponsorship.
- CANSLIM's S (Supply-Demand) and SEPA's confirmation/violation framework share the same underlying price-and-volume logic.
SEPA confirmation signals are post-entry price-and-volume evidence that your buying thesis is working: quick profit after breakout, low-volume pullbacks holding support, strong-volume closes, and Pocket Pivots reappearing.
SEPA violation signals are post-entry warnings that the original thesis is being rejected: immediately going underwater, more down days than up days, high-volume breaks of the 10MA/50MA, weak low-volume bounces, and pullbacks that fail to recover.
Operating conclusion: add only when confirmation votes clearly outnumber violation votes; reduce or exit when violations dominate. If multiple stop-losses trigger in the same week, treat it as a market-environment warning rather than a reason to bottom-fish.
Why "After Entry" Is the Real Test?
The real pressure often begins after you click the buy button. In the first few days after entry, if the stock rises 2%, you wonder: "Should I take the quick profit before it gives it back?" If it falls 2%, you wonder: "Did I buy wrong? Should I cut it now? But what if it rebounds tomorrow?" A small gain creates fear of losing it; a small loss creates fear of it expanding; a flat position feels like dead capital. Every trading day starts to feel like waiting for a verdict, yet without a steady reference point telling you what the next step should be.
That is why many investors spend all their energy on "when to buy," then become unstable after the position is actually open. Without a framework, every candle looks like a signal, every pullback looks like danger, and every bounce looks like hope. The result is either selling true leaders too early, or holding broken positions because admitting the trade failed is emotionally hard. Mark Minervini repeatedly emphasizes: stock selection and entry account for only half of success — position management is the multiplier of profitability.
The core of position management is translating emotional noise into a continuous two-way dialogue. The market tells you every day: "This trade is working, keep holding or even add more," or "Something is wrong with this trade — time to reassess." Confirmation signals and violation signals are the post-entry anchor. They do not guarantee every trade will work, but they tell you what you are watching, what you are waiting for, what you should tolerate, and when you must act. Investors who correctly interpret this dialogue can turn a potential 20% gain into 200%, while keeping a 10% loss contained within 7%.
"The behavior of a stock is its most honest language. It never lies, but it requires you to learn to listen." — Mark Minervini
What Are Confirmation Signals?
Confirmation signals mean the market is "validating" your entry thesis. They are not a single event, but a cumulative pattern of price and volume behavior showing that institutional investors are continuing to buy and hold your stock. If you are not yet familiar with the entry tools themselves, review E-04 Pivot Point and Pocket Pivot first to separate an initial entry point from an add-on confirmation.
Minervini distilled every stock that "behaves healthily after you buy it" down to six common traits — the most condensed "confirmation" checklist there is:
- Profitable immediately — a good entry tends to work quickly
- Follow-through buying after the breakout — not a one-day wonder
- More up days (and weeks) than down
- More good closes than bad — closing in the upper half of the range more often than the lower
- Tennis Ball Action — quick bounces out of pullbacks
- Healthy volume — high-volume rallies, low-volume pullbacks (the contrast is what matters)
A simple mnemonic: violations are simply all six of these inverted: underwater immediately, no follow-through, more down days than up days, closing near the low again and again, the egg that cannot bounce, and high-volume declines followed by low-volume rallies. You do not need to memorize a separate vocabulary. Ask one question: is this stock doing the opposite of what healthy leaders normally do? The closer the answer gets to yes, the less it is "normal volatility" and the more it is the market rejecting your holding thesis.
✅ Price Confirmation Signals
- Closes near the day's high (short upper shadow)
- Up days close in the upper half of the daily range
- Pullbacks hold the 10-day moving average or the breakout point
- Multiple tests of support, each followed by a V-shaped bounce
- Price tightens (Tight Area) and walks sideways above moving averages
- Stock shows relative strength on weak market days
⛔ Price Violation Signals
- Closes near the day's low (short lower shadow)
- Down days close in the lower half of the daily range
- Breaks below the 10-day moving average without quick recovery
- Retests the breakout point but fails to hold, continues lower
- Multiple consecutive down closes, pattern gradually deteriorating
- Stock declines on a strong market day
✅ Volume Confirmation Signals
- Up days show significantly expanded volume (≥ 20%+ above average)
- Down days show significantly reduced volume (low-volume pullback)
- Pocket Pivot Point re-emerges (volume contracts then explodes on an up day)
- Gap-up days maintain volume above average
- Institutional buying day (large volume, closes high, gap not filled)
⛔ Volume Violation Signals
- Down days have expanded volume (high-volume selling)
- Up days have declining volume (low-volume bounce)
- Multiple consecutive high-volume down days (distribution pattern)
- A large-volume candle engulfs the previous up candle
- Volume spikes when breaking below a moving average (institutional exit)
Confirmations and violations are not single events — they are a running scoreboard. Any given day can throw up a scary down candle or a pretty up candle; watch only one day and you will get whipsawed. In practice: after each close, log one "confirmation vote" or "violation vote" for the stock: did it close high or low, did volume contract or expand, did it hold or lose the moving average, did it recover quickly or stay broken? Over a week, tilt your position toward whichever side clearly has more votes.
For example, if five trading days include three low-volume pullbacks and two high-volume closes, selling pressure is shrinking and buyers are still in control; one black candle does not require immediate exit. But if most down days in the week come on heavier volume, rallies happen on lighter volume, and closes keep sinking toward the low of the day, sellers are expanding and buyers are walking away. That is not a routine shakeout.
The direction of volume matters more than any single day's magnitude. The key question is not whether one day fell 2% or 4%, but whether the week says "sellers are shrinking and buyers are in control" or "sellers are expanding and buyers are leaving." That trend is the signal; a single candle is usually noise. The exception is three consecutive high-volume selloffs: if all three candles show materially above-average selling pressure and weak closes, that is usually not noise anymore. You do not need to wait for a full weekly score; reduce sharply or exit first, then let the stock prove itself again.
The Importance of Support Levels: From 10MA to 50MA
In Minervini's system, moving averages are not just "trend indicators" — they are support levels that define the market's position-holding logic. Different moving averages represent institutional cost zones across different time frames. Breaking below one means the holding thesis for that time frame has been violated.
Moving average support levels are context-dependent. A strong stock that just broke out of a base may briefly dip below the 10MA on low volume and still be a healthy Tennis Ball pullback. But if a stock has already risen 50%+ and is in a late-stage run, the tolerance for a 10MA break must be sharply reduced.
Time Stop: The Overlooked Third Dimension
Most investors only set a "price stop" (e.g., exit at a 7% loss), but Minervini's system equally emphasizes a time stop — if a stock fails to make meaningful progress within 3 to 4 weeks of entry, that itself is a signal. The important reason is this: the breakout has not gained recognition from institutional investors. Truly strong breakouts usually attract large pools of capital quickly. If three or four weeks pass and price is still stuck near the entry point, either big money never came in, or the demand was not strong enough to push the trend.
If the stock has not advanced more than 10% above the entry point within 3–4 weeks of entry, seriously evaluate:
- Opportunity cost of capital: These funds may have better deployment opportunities
- Insufficient institutional sponsorship: the breakout did not attract enough large-money follow-through, so demand failed to expand
- Pattern validity: The base may have been weaker than expected
- Market conditions: The broader market may not be supporting breakouts
A time stop does not necessarily mean a full exit, but at minimum reduce to half position and redeploy capital to higher-momentum candidates.
Accumulating Confirmations: From Half to Full Position
SEPA's entry strategy is inherently designed for staged position building (see E-05 Handle Cheat series). The emergence of confirmation signals is exactly the trigger for adding to the position.
| Accumulated Confirmation Signals | Suggested Position Size | Action |
|---|---|---|
| Breakout from base (initial signal) | 25%–50% | Initial entry, set stop-loss |
| First low-volume pullback holds support | 50%–75% | Consider a small add to position |
| Pocket Pivot / re-breakout re-confirmation | 75%–100% | Add during the main advance, gradually building toward target position size |
| Multiple consecutive up weeks, pattern expanding | 100% (or use PMCC) | Consider using options to increase exposure |
The Pocket Pivot / re-breakout re-confirmation discussed here is not the first Pocket Pivot that appears when a base is just completing. A bottom-area Pocket Pivot is like the first base camp: it helps you establish an initial position as a Stage 2 advance begins. In M-02, we are talking about what happens after entry, after the stock has already moved higher, and after a new high-level consolidation forms within the same Stage 2 trend. This logic connects directly to the supply-contraction idea in E-02 VCP, but it occurs on a higher price platform.
Think of climbing Mount Everest. You do not return to sea level each time; you build new camps at higher altitudes. The first base breakout is Base Camp. Each later healthy consolidation, low-volume support hold, Pocket Pivot, or re-breakout is Camp 1, Camp 2, Camp 3. You add not because you want more profit, but because the stock proves again at a higher level that the trend is alive and institutional money is still willing to follow through.
That kind of add has one prerequisite: the original position already has a profit buffer and the stop has been raised. If the stock is still grinding around the entry point without confirmed profit, adding turns into averaging down. True SEPA pyramiding rewards strength; it does not rescue weakness.
In the PVL trading framework, "A/D Rating ≥ C" is the quantitative indicator of continuous institutional confirmation. A rising A/D Rating means institutions are still buying (confirmation); a falling A/D Rating means institutions are beginning to sell (violation). This is the bridge that integrates Minervini's confirmation/violation system with CANSLIM's S indicator.
Responding to Violation Signals: Three-Step Decision Process
When violation signals appear, Minervini advises against emotionally liquidating everything immediately, and equally against numbly waiting for a reversal. Instead, follow a structured three-step decision process:
| Step | Question | Evaluation Criteria | Action |
|---|---|---|---|
| 1. Assess Severity | Is this a minor warning or a major violation? | Volume intensity, depth of support break, whether pattern is damaged | Minor: observe 1–2 days Major: execute stop-loss immediately |
| 2. Verify Market Context | Is this a stock-specific issue or a broad market retreat? | SPY/QQQ same-day performance, days since FTD, market A/D line | Market also correcting: observe Only the stock is falling: treat seriously |
| 3. Execute Decision | Full exit, half exit, or hold? | Remaining profit cushion, stop-loss percentage, capital opportunity cost | More flexibility when a profit buffer exists Be decisive if just entered with no buffer |
Confirmation vs. Violation: CANSLIM × SEPA Comparison
| Dimension | CANSLIM (O'Neil) | SEPA (Minervini) |
|---|---|---|
| Core signal source | Weekly IBD metrics (A/D Rating) | Daily after-market price and volume analysis |
| Confirmation signals | A/D Rating A/B, breakout from base on volume | Low-volume pullback holding moving average, Pocket Pivot, Tennis Ball |
| Violation signals | A/D Rating D/E, consecutive Distribution Days | Pullback turns into an "egg": high-volume decline, can't bounce, breaks key support |
| Time frame | Weekly chart primary, longer holding period | Daily chart primary, flexible adjustments |
| Stop-loss trigger | Falls 7–8% below entry point | Violation signal appears + breaks key support |
Practical Case Study: Two Outcomes from the Same Pattern
The best way to understand confirmation and violation signals is through a hypothetical comparison. Assume two stocks, A and B, both experience a "first-week pullback" after a VCP breakout:
✅ Stock A: Confirmation-Type Pullback
- Starts pulling back on day 3 after breakout
- Volume continues to contract throughout the pullback
- Closes hold above the 10MA
- A Pocket Pivot appears on day 5
- Outcome: continues to rally +30%
⛔ Stock B: Violation-Type Pullback
- Large-volume reversal on day 2 after breakout
- Volume gradually expands throughout the pullback
- Breaks below 10MA, fails to recover next day
- Consistently closes below the breakout point
- Outcome: retraces to the base bottom
The critical difference between the two is not "how much it fell," but the direction of volume. Stock A's selling pressure is shrinking — buyers are still in control. Stock B's selling pressure is expanding — institutions are exiting.
Seeing confirmation signals but not adding to the position, seeing violation signals but not exiting. Both mistakes are equally damaging — the first causes you to miss the 200% mega-move opportunity; the second turns a -10% loss into -40%. The market's language is clear. The problem is always whether we are willing to listen.
Even more damaging are arguing with the position and averaging down. When violation signals have already appeared, telling yourself "this is only temporary," "the fundamentals have not changed," or "I will buy more to lower my cost" is not discipline. It is making the error larger. The cost is not only financial. It is also psychological: your capital is trapped, and every day you carry self-blame, hope, fear, and resentment. That state erodes judgment and becomes exhausting.
In practice, after a stop-loss exits you from a position, do not immediately try to bottom-fish just because the stock falls even further. That is usually unprofessional behavior. A stop-loss means the original thesis has failed; the market is telling you, "This was not the low-risk area you thought it was." Jumping back in right after being stopped out is often not a new high-probability trade. It is an emotional attempt to win back the loss.
There is also a broader warning sign: if three or more stop-losses trigger automatically within the same week, treat it as an alert that the market environment may be turning bearish. It may not be only your stock selection. It may mean that capital is rotating out of former growth leaders, and something not yet fully visible is developing beneath the surface. During the COVID-19 shock, the author's personal account triggered six stop-loss orders in one week and went directly to zero stock exposure, fully in cash. At first, it felt painful. In hindsight, the early losses were only the smallest appetizer; the later market crash and circuit breakers were the main course.
Connection to M-01: Tennis Ball Is Confirmation, Egg Is Violation
What M-01 called "how the stock reacts after a pullback" is, at its core, the specific expression of confirmation and violation signals in the context of "pullback behavior." Put the three terms in their right places:
- Natural Reaction = every normal pullback itself, a healthy part of an uptrend you're meant to hold through; the question isn't "did it pull back," but how it reacts.
- Tennis Ball = confirmation: low volume, shallow, a quick high-volume bounce → hold or even add to the position.
- Egg = violation: high-volume decline, can't bounce, breaks key support → regardless of any fundamental reasons, treat it seriously.
M-01 and M-02 together form the "two eyes" of SEPA position management — one eye reads the "shape" of the pullback; the other reads the overall "price-and-volume language." Both frameworks complement each other rather than compete.
Frequently Asked Questions
What are SEPA confirmation signals?
SEPA confirmation signals are post-entry price-and-volume evidence that the trade thesis is working. Common examples include quick profitability after breakout, strong-volume closes, low-volume pullbacks that hold the 10MA or 21MA, a Pocket Pivot reappearing, and a pullback that bounces like a tennis ball.
What are SEPA violation signals?
SEPA violation signals are post-entry warnings that the market is rejecting the original trade thesis. Common examples include going underwater immediately, more down days than up days, high-volume breaks of key moving averages, weak low-volume bounces, failure to recover after a support break, and a pullback that behaves like an egg instead of a tennis ball.
Why is no meaningful progress after 3 to 4 weeks a problem?
If a stock makes no meaningful progress within 3 to 4 weeks after entry, the breakout likely has not gained institutional sponsorship. True Stage 2 leaders usually attract large-money follow-through quickly. If price remains stuck near the entry point, investors should at least reduce exposure and redeploy capital toward stronger momentum.
Should you bottom-fish or average down after a stop-loss?
No. A stop-loss means the original entry thesis has failed. Professional execution waits for a fresh confirmation signal instead of using a lower price to rationalize the original mistake. Averaging down creates both financial damage and psychological pressure.
Further Reading and Series Navigation
Phase 3: Position Management & Exit (M Series)
M-01 Tennis Ball vs. Egg | M-02 Confirmation & Violation Signals (this article) | M-03 Failure Reset & Re-entry (coming soon) | M-04 Primary Base (coming soon) | M-05 Power Play (coming soon) | M-06 Sell Signals & Top Characteristics (coming soon) | M-07 Risk Management & Position Sizing (coming soon)
- Initial entry: ½ position, set stop-loss
- Confirmation add (¾ position): price 3–5% above entry point, healthy volume
- Prerequisite for full position: unrealized gains already serve as buffer; stop-loss moved to breakeven
- Going to full position on breakout day itself, leaving no room for pattern confirmation
- After adding, price falls back to entry point but stop-loss is not executed (changing the original plan)
- Using "adding to position" to average down cost, rather than rewarding a position that already has gains
- In a weak overall market environment, confirmation conditions can briefly be met then quickly reverse
- For smaller accounts, the transaction cost ratio of staged adding may be disproportionately high
- For highly volatile stocks, the 3–5% confirmation buffer may be insufficient — the add-on threshold may need adjustment


Comments ()