The "2x ETF as Savings" Myth: 00631L Left the Market in the Dust — Alpha, or Amplified Beta?
A 00631L DCA backtest looks spectacular, but the source is amplified beta, structural roll yield, trend compounding, and serious drawdown risk.
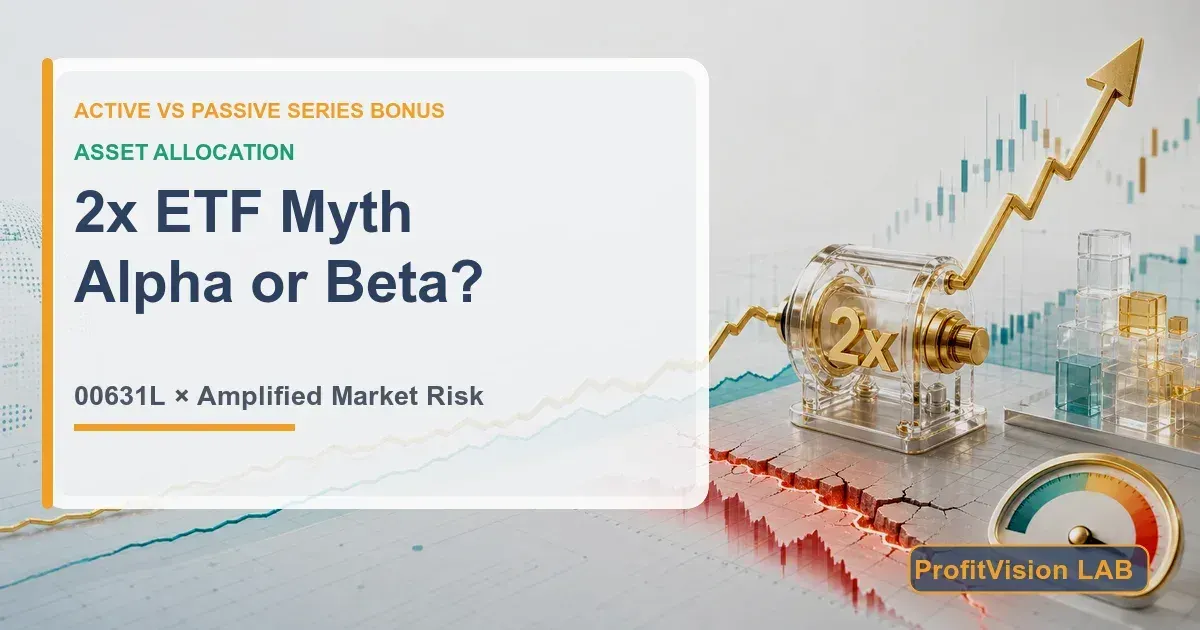
The main series argued "alpha is hard to find, even the evergreen champion lags the market." But retail investors don't play the alpha game — they bulldoze through with 2x leverage. The question is: real skill, or a gift of the trend? We let real backtests speak.
- DCA backtest (YP-Finance, 2014–2026, monthly, NT$1.41m invested): the 2x ETF (00631L) grew to NT$25.85m, far beating 0050's NT$7.59m. The number looks great.
- But its Sharpe ratio of 1.27 is the lowest of the three (0050 is 1.36) — it earned the most, but with worse risk efficiency. This is amplified beta, not stock-picking alpha.
- The excess return breaks into three layers: (A) a ~8%/yr backwardation roll-yield tailwind, (B) trend-market compounding, (C) pure 2x beta — none of it from picking stocks.
- The black swan bites back: max drawdown -44.77%. It's RR5, and the issuer explicitly says "not for long-term holding." Treating it as a savings vehicle mistakes a trend dividend for permanent skill.
First, a Monster That Left the Market in the Dust
If the main series concluded "active rarely beats the market," then 00631L looks like it came to crash the party. Using the YP-Finance DCA calculator anyone can run online, from 00631L's listing (2014-10-31) to 2026-06-03, with a fixed monthly contribution (NT$1.41m total invested), the result is:
| DCA (2014-10-31 to 2026-06-03, NT$1.41m invested) | 0050 | 00631L (2x) | 2330 TSMC |
|---|---|---|---|
| Ending value | NT$7.59m | NT$25.85m | NT$13.79m |
| Total return | 438% | 1,734% | 878% |
| Annualized (IRR) | 26.7% | 45.7% | 35.9% |
Same NT$10k a month, and over eleven and a half years the 2x ETF grew to NT$25.85m — over three times 0050's NT$7.59m, even beating a pure TSMC bet (NT$13.79m). No wonder retail is obsessed with "2x ETF savings." But before you hit buy — three things behind that number you must understand first.
Retail Treats It as "Savings," Assets Top NT$100bn
Performance like that, of course, ignited retail enthusiasm. After a split in April 2026, 00631L saw a surge in subscriptions — about 49,000 net new holders in April alone, the most of any ETF — and assets crossed NT$101.6bn in mid-April, becoming Taiwan's first leveraged ETF over NT$100bn.
But here's a jarring contradiction: 00631L is the highest risk grade (RR5), tracks the "daily" 2x return of the Taiwan 50 Index, and the Yuanta site states in black and white — "this fund is not suitable for long-term holding." A product whose issuer says not to hold long is treated as a savings darling. Who's right? The answer is in where the return comes from.
Why Has the 2x ETF Won So Much? Three Layers
To answer "should you save in it," first understand where the excess return comes from. Pulled apart, it's three things of completely different natures:
This is the piece most retail investors don't know, yet matters most. Taiwan's dividend yield is high: the total-return index compounds at about 14.19% a year versus only 10.24% for the price index — dividends add about 4 points a year. Index futures, paying no dividends, trade in persistent backwardation (futures below spot, having already discounted expected dividends). 00631L builds exposure with futures, and as they converge to spot on each roll/settlement, it recaptures that ~4% dividend-equivalent. At 2x exposure, that tailwind scales to about 8% a year — a product of Taiwan's "high yield × futures backwardation."
A daily-reset leveraged ETF, in a sustained uptrend (positive return autocorrelation), rebalances daily to "add as it rises," producing positive compounding — and over time can exceed a static 2x. Taiwan's last decade was an epic one-way bull, maximizing this effect. But remember — this is a switch, not a guarantee.
Layers A and B together are sweet, but their essence is "2x the market return" plus "a structural premium." None of it comes from stock selection, timing, or research skill. The manager isn't finding cheap great companies for you — he's just maintaining 2x exposure with futures. That's a different thing from the "real alpha" this whole series has been chasing.
The Sharpe Ratio Exposes That "Sweet" Number
How do we prove it's amplified beta rather than skill? Look at the most-overlooked yet most honest column in the same backtest — the Sharpe ratio (return earned per unit of risk taken):
| Risk efficiency (2014–2026) | 0050 | 00631L (2x) | 2330 TSMC |
|---|---|---|---|
| Annualized return | 26.7% | 45.7% | 35.9% |
| Sharpe ratio | 1.36 | 1.27 | 1.39 |
| Sortino ratio | 2.26 | 2.08 | 2.54 |
The 2x ETF earned the most (45.7% annualized), yet its Sharpe ratio is the lowest of the three (1.27 < 0050's 1.36). In plain English: the extra it earned was bought with "worse risk efficiency." If it had real alpha, its risk-adjusted efficiency should be higher, not lower. The Sharpe ratio doesn't lie — this is amplified beta, not skill.
RR5 Isn't That "Otherworldly" — a Volatility Comparison
Many balk the moment they hear "RR5, highest risk." But risk should be compared with numbers, not scared with labels. Put 00631L's annualized volatility next to the single heavyweights you might already be holding:
| Annualized volatility / max drawdown | Volatility | Max drawdown |
|---|---|---|
| 0050 | 18.84% | -24.69% |
| TSMC 2330 | 25.11% | -34.87% |
| 00631L (2x) | 35.15% | -44.77% |
| MediaTek 2454 (author's calc) | ~38.4% | — |
Look closely: 00631L's volatility of 35.15% is actually lower than holding a single MediaTek (~38%), and only a notch above TSMC (25%); its max drawdown of -44.77% is only a bit deeper than holding TSMC alone (-34.87%). In other words — "the volatility of 2x the market" is the same order of magnitude as "holding one mid-to-large-cap heavyweight." Many retail investors hold a single stock all day, bearing volatility no lower than the 2x ETF — just without an RR5 label to scare them.
00631L tracks 2x the daily return, resetting leverage each close. Over consecutive days, actual cumulative return drifts from "2x the whole move" — this is path dependence. In a one-way trend the drift is positive (you earn more); in choppy markets it's negative, producing "buy-high-sell-low" volatility decay. So the same 2x ETF wears two completely different faces depending on the market "regime."
When the Black Swan Comes, It Bites Back with Equal Force
The backtest above looks back on eleven years of a bull market from a 2026 vantage. But don't forget — that -44.77% drawdown really happened (the 2022 bear, trough around 2022-11). What leverage fears most isn't even "falling" but "chopping sideways": volatility decay in a range-bound market quietly steals your principal day by day, like a frog in slowly boiling water. Taiwan's last decade simply didn't chop sideways for long, so this risk stayed hidden.
The most dangerous thing about "2x ETF savings" is that it mistakes "a gift of the trending market" for "permanent skill." Ten years without a crash doesn't mean year eleven won't. Once a long range or bear arrives, the mechanism that amplified your wealth will amplify your losses with the very same force.
What About Discipline? DCA Is "Disciplined Greed" Amid Panic
By here, the point isn't "2x or 0050," but how, and with what mindset, you hold it. That is the real value of dollar-cost averaging — not a return-maximizing formula, but a discipline that fights human nature.
When markets crash and everyone panics, DCA automatically, mechanically, unemotionally buys you more units with the same money — the executable version of Buffett's "be greedy when others are fearful." You don't need iron nerve to "buy the bottom"; you need a deduction setting that fear can't switch off.
Persistent wealth-building breeds persistence; persistence is what lets you keep holding — and keep buying — when markets crash and blood runs in the streets, finally collecting the "windfall" others surrender out of fear. The accumulation of discipline builds the temperament for the crash.
One school of disciplined investors configures it like this: routinely DCA into both the 2x ETF and 0050; when the market crashes and everyone panics, rotate the steadier 0050 position into the 2x ETF, leaning into the amplifier. The logic is "amplify greed with discipline when fear peaks."
But let's be blunt: this is adding leverage. If you're wrong, or the chop drags on, a -44.77% or deeper drawdown awaits — and leverage amplifies that pain. This piece only states the view and its risk; it is not advice — every leverage decision is yours to own entirely.
The Total-Return Index Is Taiwan's Companies' True Ledger
Pull the lens back. This whole series has used one yardstick — the total-return cap-weighted index (含息). The headline price index you usually see lets dividends "evaporate" on each ex-date, pretending they never happened; only the total-return index honestly records the full fruit of Taiwanese companies' yearly operations. Those dividends are real cash returned to shareholders by genuinely profitable Taiwanese firms — it is the true ledger of their hard graft.
Series Wrap-Up: What Were the Four Parts + Bonus Really About?
From Buffett's bet to Taiwan's active ETFs, this series has been dismantling one thing: telling apart "real alpha" from "things that pretend to be alpha." Active funds use a hand-picked benchmark (0050) to dress beta up as alpha; retail investors use 2x leverage (00631L) to inflate beta into apparent alpha. Different forms, same essence — real alpha is rare, and hard.
And the one fair yardstick, throughout, is the total-return cap-weighted index (含息). Its 22-fold rise from 4,500 to 100,000 points is the real fruit of two-plus decades of Taiwanese enterprises' hard graft. You don't need pundits to pick stocks — with discipline and dollar-cost averaging, compound alongside these down-to-earth, still-growing Taiwanese companies, and that fruit belongs back in your own retirement account.
Markets have volatility, and black swans. But over the long run, Taiwan's market is a group of down-to-earth, still-growing Taiwanese companies. What "saving in stocks" accumulates, for Taiwanese, isn't just return — it's backbone, and the resilience to withstand volatility when the black swan comes. The people who built this island with their sweat deserve to own the island's growth.
🐕 What this series wants to return to the people of Taiwan is three things:
the right to see the truth,
the right to understand the knowledge,
the right to grow old securely through long-term investing.
Frequently Asked Questions
📚 Further Reading
- Active vs. Passive ①: Why Can't Active Funds Beat the Index Long-Term? The Buffett Bet and the SPIVA Verdict
- Active vs. Passive ②: A 100% Wipeout — the Awkward Truth About Taiwan's Large-Cap Active Funds
- Active vs. Passive ③: The Marathon Fund "Beats 0050"? Change the Yardstick and It Loses to the Market by a Length
- Active vs. Passive ④: Active ETFs Arrive — You're Buying a Manager's Alpha Résumé, Not a Low Fee
Leveraged ETFs carry extremely high risk and can cause severe losses in a short time; assess your own risk tolerance carefully. Past performance does not guarantee future results.
Sources & method: the DCA comparison (ending value, total return, annualized, Sharpe, Sortino, max drawdown, annualized volatility) is from YP-Finance (tool.yp-finance.com) DCA calculator, period 2014-10-31 to 2026-06-03, monthly contributions, NT$1,410,000 invested, computed on an adjusted-NAV basis. MediaTek (2454) annualized volatility of ~38.4% is the author's own calc from yfinance adjusted daily data; the total-return index 14.19% / price index 10.24% and the 4,524→100,966-point rise are from Taiwan Stock Exchange primary data and related reporting. The "~8%/yr" backwardation roll yield is a structural estimate (Taiwan dividend yield ~4pp × 2x exposure) that varies year to year with yield and basis. DCA is a cost-averaged basis and must not be conflated with "lump-sum since-inception return." 00631L basics, assets, and holder counts are from Yuanta's official disclosures and TWSE (early June 2026).
Comments ()