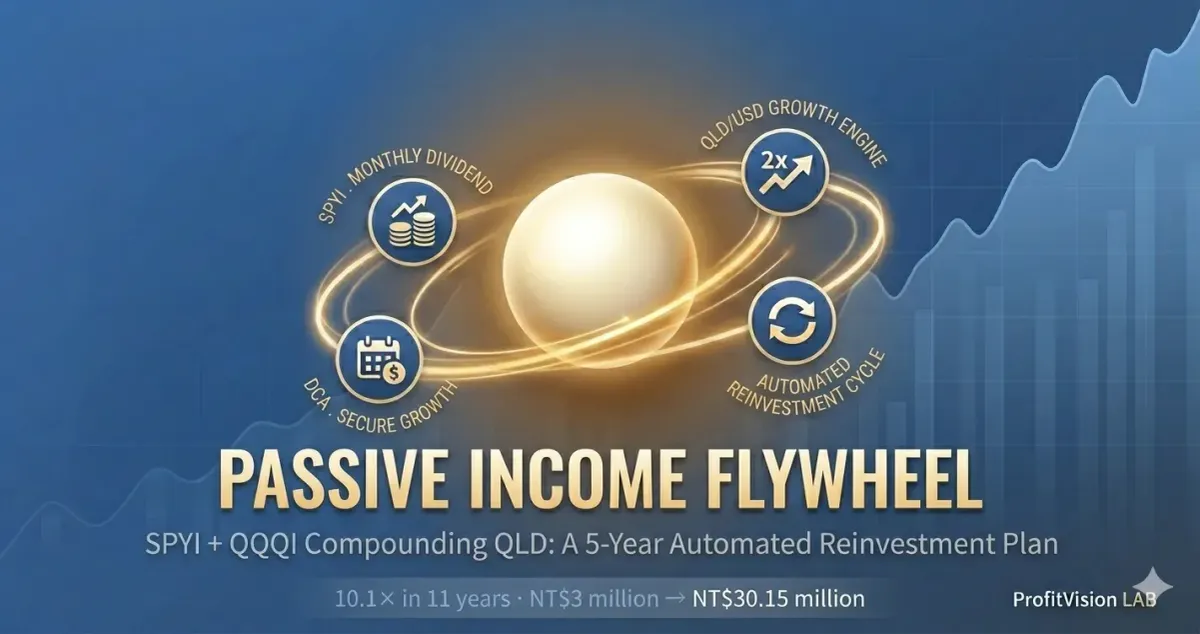
I. Why This Strategy Lets You Sleep at Night
Many investors are afraid of "2× leveraged ETFs" — and for good reason. In 2022, QQQ dropped 33% while QLD fell nearly 60%. If you put $93,000 into QLD all at once, you'd watch $56,000 evaporate on paper. That kind of pressure is more than most people can handle.
The flywheel strategy described in this article solves that psychological problem at its root. The entire logic can be stated in one sentence:
What you invest in 2× leverage is only the monthly dividends those ETFs pay you.
This difference changes everything. Say you invest $93,000 in SPYI + QQQI. The blended annual yield is about 13.2%, generating roughly $1,020/month. That $1,020 flows into QLD and USD — not your principal, but the "rent" the ETF pays you.
Even if QLD drops from $1,020 to $600 the next day, your $93,000 core position hasn't moved. SPYI and QQQI will still wire the next dividend next month. You haven't lost your principal — you just see paper fluctuations in the growth pocket. The psychological pressure is incomparable to putting $93,000 directly into QLD.
Three Layers of Safety
Layer One: Core Capital in Covered Call ETFs
SPYI holds every S&P 500 component; QQQI holds all 100 Nasdaq-100 constituents. Even when markets fall, these ETFs are backed by the indices themselves — not high-risk individual stocks. The Covered Call strategy provides additional downside cushion: call premiums collected partially offset losses during declines.
Layer Two: Monthly Dividends Are "Someone Else's Money"
The monthly income flowing in didn't come from your wallet — it's option premium paid by market participants. Using that income to buy high-risk QLD dramatically reduces the psychological sense of "loss." Even if QLD went to zero (an extreme assumption), you'd only lose the accumulated dividends — not your original principal.
Layer Three: The Flywheel Runs Automatically — No Emotions Involved
Through IBKR's recurring investment feature, every dividend deposited automatically buys QLD + USD without you lifting a finger. The most dangerous investing mistakes happen at the most emotionally charged moments — this architecture is designed to remove your emotions from the decision loop entirely.
II. What Is the "Income Flywheel" Framework
Capital base: relatively stable · monthly dividends paid out · downside partially cushioned by call premiums
↓ monthly dividend cash flow ↓
Accumulates units every month · DCA buys more in downturns · no new principal added after initial setup
↓ over time ↓
The larger the growth layer grows, the faster the flywheel spins
The core logic: the income layer is your "factory" — it runs every month, producing cash flow. That cash is not withdrawn for consumption but reinvested into the growth layer, where it compounds at 2× the index return. Over time, the growth layer becomes the dominant source of wealth.
Why Call It a "Flywheel"?
A flywheel is hard to start but, once spinning, becomes increasingly difficult to stop. In Year 1, the growth layer is small and the income feels modest. By Year 5, the accumulated QLD/USD position has grown substantially — and the larger it becomes, the more powerful each new dividend deployment. The system accelerates under its own momentum. You don't add fuel; the flywheel feeds itself.
III. SPYI Deep Dive
| Feature | Detail |
|---|---|
| Full Name | NEOS S&P 500 High Income ETF |
| Ticker | SPYI |
| Underlying Index | S&P 500 |
| Options Strategy | SPX Call Spread (not simple covered call) |
| Annual Yield | ~12% |
| 3-Year Annualized Return | ~16% |
| Expense Ratio | 0.68% |
| Distribution Type | Primarily Return of Capital (ROC) |
| Tax Treatment | Section 1256: 60% long-term / 40% short-term capital gains rate |
SPYI uses SPX index options — classified as Section 1256 contracts under US tax law, benefiting from a blended 60/40 tax rate. Even if held less than a year, 60% of gains qualify for the long-term capital gains rate. More importantly for non-US investors: most distributions are classified as Return of Capital (ROC), which is essentially the ETF returning a portion of your invested principal — not recognized as income — so the US does not withhold the standard 30% dividend tax.
SPYI uses a Call Spread rather than a simple covered call: it sells an ATM call and simultaneously buys a further OTM call, capping the downside of the short position. This architecture allows SPYI to retain meaningful upside participation when markets rally — a key advantage over XYLD-style ETFs that sell ATM calls and forfeit nearly all upside.
IV. QQQI Deep Dive
| Feature | Detail |
|---|---|
| Full Name | NEOS Nasdaq-100 High Income ETF |
| Ticker | QQQI |
| Underlying Index | Nasdaq-100 |
| Options Strategy | NDX Call Spread |
| Annual Yield | ~14% |
| Expense Ratio | 0.68% |
| Distribution Type | Primarily Return of Capital (ROC) |
| Relationship to QLD | Same Nasdaq-100 base index — "conservative income + leveraged growth" pair |
QQQI is the natural income counterpart to QLD. Both are built on the Nasdaq-100 — QQQI extracts premium income while capping some upside; QLD captures 2× the index's daily move. Together, they form a "collect rent from QQQ, then deploy that rent back into 2× QQQ" loop. Same underlying index, one collecting steadily, the other accelerating hard.
V. Why SPYI + QQQI, Not JEPI or XYLD?
| ETF | Underlying | Strategy | Annual Yield | Upside Capture | Tax Efficiency |
|---|---|---|---|---|---|
| SPYI | S&P 500 | SPX Call Spread | ~12% | High (Call Spread retains partial upside) | High (ROC + 1256) |
| QQQI | Nasdaq-100 | NDX Call Spread | ~14% | High | High |
| XYLD | S&P 500 | ATM Call write | ~10% | Low (nearly all upside surrendered) | Medium |
| JEPI | S&P 500 select | ELN notes | ~8% | Medium | Low (income mostly ordinary dividend) |
SPYI and QQQI win on three dimensions simultaneously: higher yield, better upside participation, and superior tax efficiency. For non-US investors, the ROC treatment is the decisive advantage — it means the ETF's monthly distributions land in your account without US withholding deducted.
VI. Recommended Portfolio Design
The framework below illustrates the strategy logic. Actual allocations should be adjusted based on your individual asset size and risk tolerance.
| Asset | Weight | Approx. Annual Yield (pre-tax) | Role |
|---|---|---|---|
| QQQI | 60% | ~14% | Primary engine: highest yield, QLD-aligned, tax-friendly |
| SPYI | 40% | ~12% | Diversifier: S&P 500 base, reduces Nasdaq concentration |
| Blended Income Yield | 100% | ~13.2% | Monthly output, fully reinvested into growth layer |
Growth Layer (funded entirely by dividends)
| Asset | Weight | Description | Role |
|---|---|---|---|
| QLD | 50–70% | ProShares Ultra QQQ (2× daily Nasdaq-100) | Primary amplifier: Nasdaq upside at 2× |
| USD | 30–50% | ProShares Ultra Semiconductors (2× daily) | Concentration kicker: AI/chip cycle alpha |
The Antifragile Logic of DCA in Bear Markets
The flywheel's most underappreciated feature is what happens during market crashes. Consider 2022: QLD fell 60%, but your income layer kept paying dividends. That monthly $1,020 was now buying QLD at 40 cents on the dollar — automatically, without you needing to make any decision or summon courage. When 2023 arrived and QLD rallied 117%, every unit bought at the 2022 lows delivered maximum gain. The system was panic-buying on your behalf while you slept.
Every bear market is an automatic DCA opportunity.
VII. IBKR Setup: 5 Steps to Full Automation
Interactive Brokers (IBKR) supports a "Recurring Investment" feature that allows automatic periodic purchases of ETFs. Once configured, monthly dividend reinvestment into QLD + USD requires zero manual action.
Open an IBKR account at ibkr.com. Select "Individual" account type. For non-US investors, enable international trading permissions and USD account funding.
Wire funds in USD (or convert from local currency). Purchase your target allocation: ~60% QQQI + ~40% SPYI. Use limit orders during market hours for better fills.
In IBKR → Portfolio → Recurring Investment → Add New. Set QLD and USD as targets with your desired allocation (e.g., 50%/50%). Frequency: Monthly. Amount: leave as "invest cash balance" so the system automatically sweeps incoming dividends each month.
SPYI and QQQI pay monthly (typically mid-month). Verify that your IBKR Recurring Investment is scheduled 2–3 days after the expected payment date to ensure funds are settled. Set up a trade confirmation notification to your email.
Check actual QLD/USD split. If QLD has outperformed and drifted above 75%, trim back to 70%. Review QQQI/SPYI distribution announcements for any major strategy changes. Log annual foreign income records for tax purposes (see Section VIII).
VIII. Tax Treatment for Taiwan-Based Investors
Most income from US ETF investing is subject to a 30% US withholding tax. SPYI and QQQI are a major exception — and understanding exactly why matters for net returns.
Taiwan's Alternative Minimum Tax (AMT) and Overseas Income
Taiwan's personal income tax system includes an Alternative Minimum Tax (AMT) rule for overseas income. If total overseas income for the year is below NT$1 million (~USD$31K), it is fully excluded from the AMT base — no declaration required. If overseas income exceeds NT$1 million but the individual's total AMT base remains below approximately NT$6.4 million (~USD$200K), no AMT is owed and no additional tax preparation is required.
Tier 1
overseas income
Fully excluded from AMT base
No declaration needed
Tier 2
AMT base
Included in AMT base
but below threshold
No AMT owed
Tier 3
AMT base
Exceeds AMT threshold
Requires calculation
AMT at 20% on excess
US Withholding Tax by Investment Type
| Investment Type | US Withholding | Taiwan Foreign Tax Credit | Effective Rate | Distribution Nature |
|---|---|---|---|---|
| SPYI / QQQI | ≈ 0% | — (no withholding to reclaim) | ≈ 0% | Mostly ROC (Return of Capital) — not classified as income |
| BDC Stocks HTGC / ARCC / MAIN |
30% withheld at source | ~90% refunded via Taiwan AMT credit | ≈ 3% | Ordinary dividend — treated as income |
| XYLD / QYLD (historical proxies) |
Partial (~15–20%) | Available but requires filing | ≈ 5–8% | Mixed: partial ROC, partial dividend |
The ROC Advantage Explained
SPYI and QQQI classify most distributions as Return of Capital (ROC). ROC is essentially the ETF returning a portion of your invested principal — the US government does not classify this as taxable income, so no 30% withholding applies. From a Taiwan investor's perspective, ROC's classification as a "cost basis reduction" rather than income is also favorable for AMT calculation — though you should consult a tax professional for your specific situation.
IX. Historical Backtest: 2014–2024 Real Data
SPYI launched in August 2022 and QQQI in January 2023 — far too recent for a meaningful 10-year backtest. We use the closest historical proxies available and run the full 11-year simulation on real market data. Every number below comes from actual closing prices, not modeled assumptions.
| Flywheel Layer | Proxy Used | Justification |
|---|---|---|
| Income Layer (60%) | XYLD — Global X S&P 500 Covered Call ETF | Same S&P 500 covered call strategy as SPYI; live since June 2013 |
| Income Layer (40%) | QYLD — Global X Nasdaq-100 Covered Call ETF | Same Nasdaq-100 covered call strategy as QQQI; live since December 2013 |
| Growth Layer (50%) | QLD — ProShares Ultra QQQ (2×) | Direct — no proxy needed |
| Growth Layer (50%) | USD — ProShares Ultra Semiconductors (2×) | Direct — no proxy needed |
Backtest Assumptions
Initial investment: $93,000 USD, fully allocated to the income layer (60% XYLD + 40% QYLD). XYLD annual yield assumed 9%; QYLD assumed 11%; blended ~9.8%. All dividends transferred to growth layer (50% QLD + 50% USD) annually. Income layer tracked using price return (total return minus dividend yield) to avoid double-counting. Backtest period: January 2014 – December 2024 (11 years).
Year-by-Year Results (USD)
| Year | QLD / USD Return | Dividends to Growth Layer | Income Layer Value | Growth Layer (QLD+USD) | Total Portfolio |
|---|---|---|---|---|---|
| 2014 | +37.6% / +78.0% | $9,114 | $89,741 | $9,114 | $98,855 |
| 2015 | +14.7% / -7.5% | $8,795 | $83,822 | $18,238 | $102,060 |
| 2016 | +10.2% / +57.2% | $8,215 | $81,026 | $32,594 | $113,620 |
| 2017 | +70.3% / +81.7% | $7,941 | $87,197 | $65,316 | $152,513 |
| 2018 | -8.3% / -26.9% | $8,545 | $74,401 | $62,353 | $136,754 |
| 2019 | +81.7% / +110.4% | $7,291 | $83,413 | $129,525 | $212,938 |
| 2020 | +88.9% / +68.2% | $8,174 | $77,904 | $239,428 | $317,332 |
| 2021 | +54.7% / +104.3% | $7,635 | $82,674 | $437,336 | $520,010 |
| 2022 ⚠️ | -60.5% / -68.6% | $8,102 | $62,275 | $163,181 | $225,456 |
| 2023 | +117.1% / +228.8% | $6,103 | $65,987 | $451,531 | $517,518 |
| 2024 | +42.8% / +139.6% | $6,467 | $72,343 | $869,884 | $942,228 |
※ Initial $93,000 in income layer. XYLD yield 9%, QYLD yield 11% (historical averages). Annual return data: Yahoo Finance historical closing prices. Dividends simplified as annual lump reinvestment. Excludes transaction costs, currency fluctuations, taxes. Past performance does not guarantee future results.
The 2022 Bear Market: Where the Flywheel Proved Its Worth
2022 was the ultimate stress test. QLD fell 60.5%, USD fell 68.6%. The growth layer collapsed from $437,336 to $163,181. Total portfolio dropped from $520,010 to $225,456 — a -56.6% drawdown.
But the flywheel did exactly what it was designed to do: XYLD + QYLD kept paying dividends — $8,102 that year — automatically buying QLD and USD at their deepest lows. When 2023 arrived with QLD +117% and USD +229%, those units purchased in the trough delivered maximum gains. By year-end 2023, the total portfolio had nearly fully recovered to $517,518.
Psychological key: Your $93,000 core position never left the income layer. The growth layer's volatility was real — but it was volatility of accumulated dividends, not your original capital. That distinction matters enormously for staying the course.
Strategy Comparison (2014–2024)
| Strategy | Initial | End-2024 Value | Multiple | 2022 Drawdown | Barrier to Execute |
|---|---|---|---|---|---|
| Flywheel XYLD+QYLD → QLD+USD DCA |
$93,000 | $942,228 | 10.1× | -56.6% | Low: automated, 15 min/month |
| QLD Lump Sum All-in 2× Nasdaq at once |
$93,000 | $1,641,587 | 17.7× | -60.5% | Extreme: requires committing $93K all at once and holding through -60% |
| SPY Lump Sum S&P 500 index buy-and-hold |
$93,000 | $362,209 | 3.9× | -18% | Very low: most stable, but smallest long-term gain |
grew into $869,884. The $93,000 core never moved.
QLD lump-sum's 17.7× is impressive, but the conditions are brutal: you must commit $93,000 all at once in January 2014 and hold completely still through a -60% drawdown in 2022. Most investors would not. The flywheel earns 10.1× in exchange for dramatically higher executability — the auto-buying mechanism means you compound through crashes rather than selling into them.
IX-B. Starter Version: $300/Month DCA — 11-Year Results
Not everyone has $93,000 to deploy at once. The flywheel also works as a monthly DCA plan. Below: $300/month invested into the income layer (XYLD+QYLD), with all dividends automatically reinvested into QLD+USD. Starting January 2014, running to December 2024. Total cash invested: $39,600 (132 months × $300).
| Year | Cumulative Invested | Income Layer | Growth Layer (QLD+USD) | Total Portfolio | Annual Dividends → Growth |
|---|---|---|---|---|---|
| 2014 | $3,600 | $3,531 | $218 | $3,749 | $188 |
| 2015 | $7,200 | $6,768 | $753 | $7,522 | $520 |
| 2016 | $10,800 | $10,077 | $1,961 | $12,038 | $840 |
| 2017 | $14,400 | $14,592 | $5,032 | $19,624 | $1,225 |
| 2018 | $18,000 | $15,757 | $5,516 | $21,273 | $1,493 |
| 2019 | $21,600 | $21,498 | $13,327 | $34,825 | $1,844 |
| 2020 | $25,200 | $23,548 | $26,713 | $50,261 | $2,217 |
| 2021 | $28,800 | $28,708 | $51,330 | $80,038 | $2,579 |
| 2022 ⚠️ | $32,400 | $24,723 | $19,865 | $44,588 | $2,593 |
| 2023 | $36,000 | $29,912 | $58,608 | $88,520 | $2,696 |
| 2024 | $39,600 | $36,578 | $116,515 | $153,093 | $3,280 |
※ Monthly DCA $300 into income layer. Monthly dividend rate = annual yield ÷ 12, reinvested into growth layer. Growth layer computed with monthly compounding. Excludes fees, taxes, currency effects.
$300/month × 132 months
11 years of disciplined DCA
3.87× on invested capital
IRR ≈ 13.1% per year
SPY DCA same period: $90,558
Flywheel earns +$62,535 more
The DCA version also exhibits a smaller 2022 drawdown (-44.3% vs -56.6% for lump sum), because the growth layer is smaller in the early years — less accumulated position means less dollar loss. Meanwhile, the monthly DCA into the income layer continues uninterrupted through the bear market, building the dividend engine that powers the 2023–2024 recovery.
Which Version Fits You?
| Version | Deployment Method | Total Capital Deployed | End-2024 Value | Multiple | 2022 Max Drawdown |
|---|---|---|---|---|---|
| Lump Sum (Section IX) | $93,000 one-time into income layer | $93,000 | $942,228 | 10.1× | -56.6% |
| Monthly DCA (this section) | $300/month for 11 years | $39,600 | $153,093 | 3.87× | -44.3% |
| SPY Monthly DCA (benchmark) | $300/month into S&P 500 | $39,600 | $90,558 | 2.29× | -18% |
X. Key Risks — Fully Disclosed
Severe Drawdowns in 2× ETFs
QLD fell roughly 79% from peak to trough during the 2022 bear market. Although the flywheel strategy deploys dividends rather than core capital into 2× ETFs, paper losses of this magnitude can still trigger psychological panic that leads investors to sell at the bottom — destroying the DCA benefit. Before starting, make a firm commitment: "If QLD drops 60% on paper, I will not sell." If you cannot honestly make that commitment, 2× ETFs are not appropriate for you.
SPYI / QQQI Dividend Compression
If markets enter a sustained low-volatility regime (VIX persistently below 15), the option premiums these ETFs collect will compress significantly. Yields could fall from 12–14% to 7–9%. The flywheel slows — but the core capital remains intact and continues generating income.
Nasdaq Concentration Risk
QQQI, QLD, and USD are all closely correlated with Nasdaq and semiconductors. A structural re-rating of the tech sector (regulatory, geopolitical, valuation bubble) would pressure both layers simultaneously. SPYI's S&P 500 base provides partial diversification, but the overall portfolio remains tech-heavy.
Currency Risk (for non-USD investors)
Investors measuring returns in local currency bear USD/local FX exposure. A weakening USD reduces real returns when converted back. Over the long term, USD-denominated assets retain strategic value, but short-term FX should be factored into the overall portfolio.
Volatility Decay (Beta Slippage)
2× ETFs rebalance daily. In sustained choppy markets (2015–2016, most of 2022), volatility decay causes real returns to fall well below "index × 2" intuition. The flywheel's DCA mechanism partially mitigates this by buying cheaply during drawdowns, but the effect cannot be fully eliminated.
IBKR Execution Risk
Misconfigured recurring investment settings, insufficient settled cash, or platform outages may cause automated buys to miss. Spend 5 minutes monthly confirming the recurring buy executed and enable trade confirmation email notifications.
XI. Who Is This Strategy For?
| Criterion | Description |
|---|---|
| ✅ Limited time | Professionals, entrepreneurs, or busy individuals who can invest 15–30 minutes per month |
| ✅ No interest in options | Not interested in learning Delta, DTE, or roll mechanics — prefer full automation |
| ✅ 5+ year time horizon | No need to access this capital within 5 years; patient enough to let the flywheel build |
| ✅ Can stomach volatility | Able to continue DCA through 40–60% paper losses without panic-selling |
| ✅ Nasdaq long-term conviction | Believes technology and AI-driven Nasdaq-100 will continue leading returns over the next decade |
| ❌ Not suitable: capital needed soon | If this is your emergency fund or needed within 3 years, this strategy is inappropriate |
| ❌ Not suitable: conservative risk profile | 2× ETF volatility exceeds the psychological tolerance of most conservative investors |
| ❌ Not suitable: short-term trading | Flywheel effects require time to compound; results over 1–2 years are not indicative |
XII. Advanced Version: Active Investors Who Want More Cash Flow
If you're willing to spend 1–2 hours per month and want to maximize income, consider replacing part (or all) of the income layer with actively managed Business Development Companies (BDCs) combined with a Covered Call overlay.
Leading BDC names include Hercules Capital (HTGC), Ares Capital (ARCC), and Main Street Capital (MAIN). These typically yield 9–10% annually in dividends, and selling monthly OTM Covered Calls on the position adds another 10–15% in premium income — bringing total annual cash flow to 20–25%.
For Taiwan investors: US withholding on BDC dividends is 30%, but approximately 90% is refunded the following year via Taiwan's foreign tax credit mechanism — bringing the effective tax rate to roughly 3%. This significantly narrows the gap versus SPYI/QQQI's near-zero withholding.
The prerequisite is clear: you must be willing to learn and execute options strategy — selecting strikes, managing DTE, and deciding when to roll. For most investors seeking a "set it and forget it" solution, SPYI + QQQI already delivers excellent returns without the complexity.
XIII. Three Questions Before You Begin
Answer these honestly. If all three answers are "yes," this strategy is ready for you to execute:
Self-Assessment Before Starting
Question 1:
If QLD drops 60% next year, will I continue letting the monthly dividends automatically buy in — without manually stopping the plan or selling QLD?
Question 2:
Is the capital I'm deploying money I genuinely do not need to access for the next 5 years?
Question 3:
Do I believe Nasdaq-100's long-term trajectory remains upward over the next 5–10 years, even through multiple 30%+ corrections along the way?
This content is for educational and research purposes only and does not constitute investment advice. ProfitVision LAB is not a registered investment advisor in Taiwan or any other jurisdiction. All content is based on publicly available information and personal research and analysis. Accuracy and completeness are not guaranteed. ETFs, individual stocks, and strategies mentioned are used solely to illustrate the logic of the framework — they do not represent buy or sell recommendations for any specific security. Tax information is provided as general reference only; consult a qualified tax professional for your specific situation. Investing involves risk; 2× leveraged ETFs carry substantially higher risk and may result in significant loss of principal. Past performance does not guarantee future results. Evaluate your own financial circumstances and risk tolerance before making investment decisions.
Data note: ETF yield figures (SPYI ~12%, QQQI ~14%) are historical as of May 2026 and do not guarantee future distributions. Historical backtest (Section IX) uses XYLD and QYLD as proxies for SPYI and QQQI respectively (2014–2024), based on Yahoo Finance closing prices. Backtest results use simplified annual dividend reinvestment and do not account for intra-year volatility decay, monthly compounding differences, currency fluctuations, taxes, or transaction costs. Past performance does not guarantee future results. All figures in USD unless otherwise stated.
Comments ()