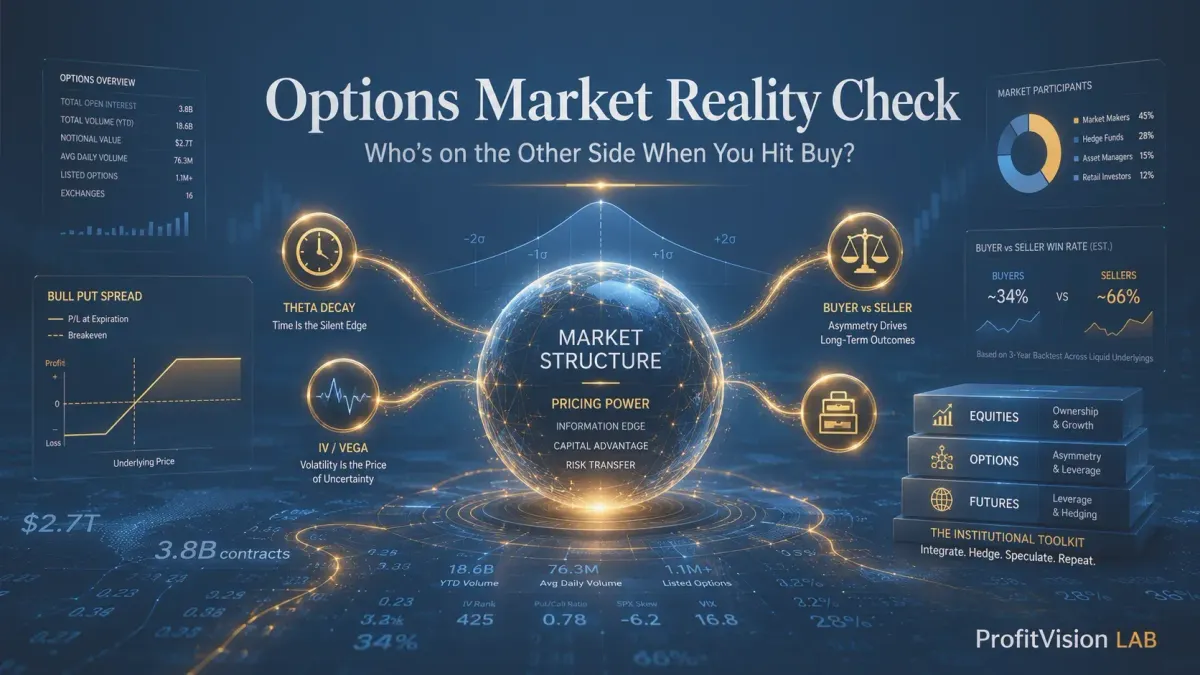
Options Market Reality Check: Who's on the Other Side When You Hit Buy?
U.S. options hit $2.7T daily notional in 2024—surpassing equities. Retail buyers lose 16.4% over 3 days on average. Sellers win 94% at expiry, but win rate is not profitability. Breaks down market depth, buyer/seller asymmetry, and the institutional cross-instrument toolbox.
Options Market Reality Check: Who's on the Other Side When You Hit Buy?
A data-driven anatomy of market size, buyer/seller win rates, Taiwan vs. U.S. market depth, and the institutional toolbox retail investors can learn to use
2026.05.22 | Shiba the Disciplined | ProfitVision LAB
Chapter 1: Market Scale — Options Have Quietly Overtaken Equities
Most retail investors still think of options as a derivative of the stock market — a side instrument layered on top of equities. But in 2022, something structurally significant happened: according to Cboe data, the average daily notional value of single-stock options first exceeded that of the underlying stocks themselves — options at $450B/day versus equities at $405B/day.
By 2024, that gap widened further.
notional volume (2024)
contracts traded (2024)
daily volume (ADV)
from 0DTE contracts
For context: the NYSE reported an average daily equity trading value of approximately $80.6B in late 2025. Options notional flow in 2024 was roughly 33× larger. This doesn't mean $2.7 trillion of real capital was changing hands — notional value reflects the contract's full exposure (shares × price × 100), amplified by leverage. But it does mean options are no longer a sideshow. They are the main event in terms of risk transmission.
One AAPL options contract controls 100 shares. At a stock price of $200, its notional value is $20,000 — even though the premium you pay might be only $200–$300. This is leverage at its structural core: a small amount of capital expresses a large notional exposure.
⚠️ This is also why "options notional exceeding equities" does not mean more real money is entering options than stocks — it reflects the leverage multiplier embedded in every contract.
Five consecutive record years
Cboe's official data confirms 2024 was the fifth straight record year for U.S. options volume. The standout: index options — SPX traded 784.2 million contracts, VIX options 209.2 million. The holders of these contracts are overwhelmingly institutional — pension funds, hedge funds, and asset managers using options to manage portfolio-level systemic risk at scale.
Chapter 2: Taiwan vs. U.S. — The Structural Depth Gap
For Taiwan-based investors, the most familiar options product is TXO (TAIEX Index Options) — the flagship product of TAIFEX (Taiwan Futures Exchange), tracking the weighted stock index. TXO is one of the highest-volume index options in the Asia-Pacific region.
But the structural differences between Taiwan and U.S. options markets are profound. They determine what strategies are viable, what kind of counterparties you face, and how much your transaction costs erode your edge.
Breadth: 15,000+ individual stock options + major ETFs + indices
Depth: $2.7T daily notional, multi-layer order books on liquid names
Expiry structure: 0DTE, weekly, monthly, LEAPS (2+ years)
Key participants: Market makers (Citadel, Virtu), institutions, hedge funds, pension funds, retail
Scale: World's largest; Cboe + Nasdaq + NYSE compete for flow
Breadth: TXO index options as core; individual equity options thinly traded
Depth: TXO near-month ADV in hundreds of thousands; far-month contracts thin
Expiry structure: Weekly (Wednesday expiry), monthly; no LEAPS equivalent
Key participants: Proprietary desks, foreign institutions, retail (retail ratio relatively high)
Scale: Significant in Asia-Pacific, but 30–50× smaller than U.S. in notional terms
Market depth: more than just volume
"Market depth" is not just about total volume — it's about bid-ask spreads. On highly liquid U.S. names (SPY, AAPL, NVDA), options bid-ask spreads are often 1–5 cents wide. But academic research shows that retail traders incur an average half-spread of approximately 8% — meaning every round trip costs roughly 8% of your invested premium before any market move. That friction compounds brutally over frequent trading.
TXO near-month contracts are reasonably liquid, but far-month strikes and deep OTM series carry far wider spreads. The structural asymmetry in Taiwan is pronounced: proprietary desk traders maintain full Greeks management and real-time hedging infrastructure. A retail trader entering TXO is effectively flipping coins against an actuary.
Market depth refers to the total volume of buy and sell orders sitting at different price levels. High depth means you can execute at close to theoretical fair value; low depth means your order moves the market and you absorb slippage.
In SPX options, selling 10 Iron Condors generates almost no slippage. Attempting the same size in a TXO far-month series could mean accepting significant execution deviation from mid-price.
Chapter 3: Buyers vs. Sellers — The Real Win Rate Numbers
This is the most cited — and most misunderstood — chapter in options education. "Options sellers win 90% of the time" — is that true? The number itself is real. But how you interpret it determines whether you make money or lose it.
OTM option expiry worthless rates
expire worthless
for OTM sellers
for OTM buyers
over 3-day holding period
The seller advantage looks overwhelming. But here is what rigorous research actually says:
"In a 20-Delta Iron Condor backtest, theoretical win probability was 60%. Actual backtested win rate was 79.6%. Max drawdown: 37%. Annualized return: 9.41%. Sharpe ratio: 0.62. The numbers look decent — but can you hold through that 37% drawdown?" — Option Alpha backtest data
The Win Rate Illusion: why 90% win rate can still lose money
This is the structural contradiction every premium seller must confront honestly.
⚠️ The Seller's Win Rate Trap
- If you collect $100 in premium per trade but lose $900 when the trade goes wrong, 9 wins and 1 loss = break even. High win rate, zero profit.
- This is payoff asymmetry: sellers have high win rates but outsized single-trade losses relative to gains.
- Securegate research found that traders who collected $5,000 in premium retained only $2,000 net — a "capture rate" of just 40%. Win rate tells you nothing about capture rate.
✅ The Genuine Structural Edge of Selling Premium
- Theta decay erodes buyer premium daily, automatically. Time is your ally as a seller.
- Volatility premium: implied volatility has historically and systematically exceeded realized volatility — the market consistently overpays for insurance, and sellers collect that spread.
- Defined-risk structures (Bull Put Spread, Iron Condor) cap maximum loss, making the asymmetric payoff manageable with discipline.
What academia says about retail buyers
University of Florida researchers Nimalendran, Naranjo, and Wu found that retail losses on complex option trades around earnings are three times larger than on ordinary trading days. London Business School data from 2019–2021 shows retail traders lost more than $2 billion in short-dated options premium over that period.
Before earnings, implied volatility (IV) inflates to price in uncertainty. Once results are released, the uncertainty collapses — and so does IV. Even if the stock moves in your direction, the Vega loss (value lost from IV collapse) can erase your directional gain entirely. This is called IV Crush.
⚠️ The Four-Layer Defensive Screen (4LDS) applied at ProfitVision LAB does not initiate new directional buyer positions when the primary thesis is "betting on an earnings move." IV Crush is a predictable, systematic event — not a surprise. Treat it as one.
Chapter 4: Trade Size, Order Flow, and Who Actually Controls Pricing
One insight dominates this chapter: trade size = pricing power. The larger and more consistent your order flow, the more you shape IV rather than accept it. Institutions don't just participate in the market — they define its pricing structure.
The scale gap between institutions and retail
| Participant Type | Typical Trade Size | Strategy Profile | Impact on IV Pricing |
|---|---|---|---|
| Retail traders | 1–5 contracts | Directional bets, single-leg | Negligible — passive price takers |
| Semi-professional | 10–50 contracts | Spreads, Wheel, Iron Condor | Marginal — liquidity consumers |
| Hedge funds | 100–1,000+ contracts | Delta-neutral, Greeks management, tail hedging | Large single trades can shift IV skew |
| Institutional market makers | 1,000–10,000+ contracts | Real-time Delta hedging, cross-strike arbitrage, two-sided quoting | Define bid-ask spreads and the IV surface |
Cboe's 2025 year-end review shows block trades above 1,000 contracts averaged 10 million contracts per day — up 67% from 2024. Institutions are not just growing their options usage; they are accelerating their structural dominance of options pricing. Retirement funds hedge tail risk through options. Hedge funds express macro views through index vol. Market makers harvest the liquidity premium from every order that crosses their desk.
Your order flow is someone else's raw material: PFOF
Here is something most retail traders don't know: your brokerage is selling your orders.
This mechanism is called PFOF (Payment for Order Flow). Zero-commission brokers like Robinhood and TD Ameritrade route retail orders to institutional market makers (Citadel Securities, Virtu Financial), who pay for the privilege. Why? Because retail order flow is predictably exploitable — retail traders tend to buy options at elevated IV, chase direction around earnings, and hold losers too long. The market maker's edge is systematic and consistent.
If a market maker is willing to pay for your order, it means they expect to extract more value from that order than they paid. That extraction comes from the bid-ask spread and micro IV pricing advantages. On any single trade the impact is small — but for active retail traders, this friction compounds significantly over a year.
⚠️ Taiwan markets don't have a formal PFOF system, but the information asymmetry between proprietary desk traders and retail participants produces a structurally similar outcome.
Contract size distribution: a perspective most traders miss
Research consistently shows that 70–80% of retail options trades are 1–10 contracts. In the context of total market flow, this is statistically invisible — a single institutional market maker can execute your entire year's trading volume in seconds. This is not about relative net worth. It's about understanding your structural role: you are a liquidity consumer; the market maker is the liquidity provider and toll collector.
Your edge is not speed, size, or information. Your edge is discipline compounded over time — specifically, the discipline to stay on the structurally advantaged side of the trade, in pre-selected, moat-quality underlyings, with defined risk and consistent premium-selling mechanics.
0DTE: retail lottery, market maker ATM?
Zero-days-to-expiry (0DTE) options accounted for 21.5% of SPX volume in 2024, rising to 24.1% in 2025.
⚠️ The Real 0DTE Numbers
- Cboe 2025 backtest: holding a long SPX 0DTE straddle to expiry across 199 observations produced average P&L of +$1.45 but a median of −$3.28 — a highly right-skewed distribution where most trades lose and rare events generate outsized gains.
- Outcome range: −$54 to +$335. Kurtosis of 33.58 — extreme events dominate returns entirely.
- For retail: 0DTE buying is structurally "pay small losses repeatedly, wait for a black swan." That is not a trading system. It is a statistical lottery.
- Who consistently profits from 0DTE? Market makers — collecting fragmented Theta daily, with real-time Delta hedging that neutralizes directional risk while harvesting vol premium.
Chapter 5: The Taiwan Investor Advantage — and What to Know Going In
Taiwan has one of the highest retail investor participation rates in the world. Investing is not a niche activity — it's a national pastime. Elementary school children dollar-cost average into 0050. Grandparents hold Taiwan Semiconductor as a retirement foundation. Young professionals trade ETF options on their phones. This investment culture runs deep, and it is a genuine structural advantage.
For Taiwan-based investors, options are not a foreign concept bolted onto the investing journey — they are a natural extension of an already sophisticated investing mindset. The real challenges are not fear-inducing; they are knowable. Systematic learning eliminates them one by one.
Understanding TXO market structure
long-term loss rate
options format (Wed expiry)
in TXO (annual)
per index point
TXO retail loss rates are not evidence that "Taiwanese investors can't trade options." They reflect a structural mismatch in strategy selection: most retail participants primarily buy options in weekly contracts — the combination statistically most disadvantageous to buyers. Theta decay is fastest in final days before expiry. IV in near-expiry contracts is priced at peak uncertainty levels. Retail trades against proprietary desks that manage Greeks with actuarial precision and harvest liquidity premium daily. Recognizing this structure does not mean walking away — it means choosing which side to stand on.
Entering U.S. markets: turning variables into known quantities
More Taiwan-based investors are moving into U.S. individual stock options. The advantages are real and substantial: breadth of underlyings, deep liquidity, diverse strategy space. Before entering, a few structural differences deserve explicit recognition — not as obstacles, but as variables to incorporate into your system:
✅ Four Known Variables for Taiwan Investors in U.S. Options
- Time zone — this is not a problem at all. Day traders need to watch every tick of the U.S. session. Premium sellers don't. The entire logic of selling Theta is: select your underlying using the Four-Layer Defensive Screen, enter your position with pre-set conditions, and let Theta work while you sleep. You wake up in Taiwan, and Theta has already been earning on your behalf. This isn't a compromise — it's the defining quality-of-life advantage of the premium-selling approach.
- IV Crush around earnings: More violent in U.S. individual stocks than in index products. But this mechanism is fully predictable. Learn it once, and you don't just avoid it — you position to benefit from it (selling premium into elevated IV before earnings, collecting the crush on the other side).
- Tax and compliance (W-8BEN, Portfolio Interest Exemption): Learn it once, it's permanent knowledge. Taiwan investors operating through IBKR and similar brokers have well-documented filing procedures. One-time setup.
- Margin requirements: IBKR margin rules for non-U.S. residents differ slightly from U.S. residents. Defined-risk strategies (spreads) substantially reduce margin requirements — making them a more capital-efficient starting point for Taiwan-based traders regardless.
Chapter 6: The Institutional Toolbox — and How Retail Can Learn to Use It
Here is the most important reframe in this entire article: what is the actual difference between how institutions trade and how retail traders trade?
The answer is not "they have more capital." It's this: institutions use the entire toolbox. Retail traders typically use one tool.
The three-instrument framework
| Instrument | How Institutions Use It | Typical Retail Use | Cross-Application Opportunity |
|---|---|---|---|
| Equities (Stock/ETF) | Core holdings, long-term exposure management | Buy and hold, or short-term speculation | Equity position as the base for Covered Call writing |
| Options | Premium collection, exposure hedging, view expression | Primarily directional bets | Selling Puts = setting a "discounted entry price" for intended equity buys |
| Futures | Rapid Delta adjustment, index/single-stock hedging, short exposure | Rarely accessed; often speculative | Long equity + short futures = market-neutral position |
Institutions don't ask "should I buy a Call or a Put?" They ask: "What is my current portfolio Delta? Do I need to add or reduce exposure? Which instrument achieves that most efficiently?" That is systems thinking across the whole toolbox — not single-instrument operation.
Three cross-application paths retail investors can start learning today
Institutions don't just ask "will this stock go up?" They ask: "Given this view, which instrument, under what conditions, at what cost, expresses that view most efficiently?" That mental framework — not any specific technique — is the heart of cross-instrument application.
Suggested retail learning sequence: Build equity selection logic first (stock screening) → Add premium-selling on your holdings (Covered Call / CSP) → Learn to bound risk with spreads (Bull Put Spread) → Eventually incorporate futures for Delta hedging. This is a progression from simple to complex, low-risk to higher-complexity — not a jump straight into the derivatives jungle.
What the market size data tells you as a retail investor
The U.S. options market trades 3.8 billion contracts per year, with $2.7 trillion in daily notional flow. This scale has one clear implication: the market never lacks pricing efficiency. When an option looks cheap to you, the market maker has already priced it more accurately than you have. You are not finding a bargain — you are purchasing a risk that someone else has already decided to offload at that price.
This is not defeatism. It is the foundation of replacing arrogance with humility, replacing intuition with systems.
"Think with me, not just trade with me." — At ProfitVision LAB, this means: understand the structure of what you're trading, and you will naturally arrive at the right side, at the right moment, with the right instrument.
✅ The Statistical Case for Premium Selling (with Discipline)
- Theta flows toward you every day. Volatility premium systematically favors sellers. Both are academically documented structural edges.
- Defined-risk structures (Bull Put Spread, Iron Condor) preserve seller advantages while capping maximum loss — making the asymmetric payoff manageable.
- Never span earnings with a new position; control Delta exposure; target DTE 30–45 days. These disciplines convert statistical advantage into realized profit.
⚠️ The Buyer's Structural Blind Spots
- "Buyers always lose" is wrong. "Buyers without a specific catalyst always lose" is closer to right. You need a defined trigger — technical breakout, low-IV environment, strong momentum stock — not a random directional guess.
- Buying options to bet on an earnings announcement is statistically one of the worst trade setups available. Academic literature consistently shows −10% to −14% losses on such trades.
- 0DTE buying is not a trading system. In most observations it produces losses, with rare outsized wins driven by black swan events. That is a lottery, not a strategy.
Frequently Asked Questions
15+ years in U.S. equities and options strategy. Applies the Four-Layer Defensive Screen (4LDS) to evaluate individual stocks for premium-selling suitability, and tracks structural evolution in Cboe, TAIFEX, and global derivatives markets. All research is based on public filings, exchange data, and peer-reviewed academic sources. Not investment advice.
Options trading involves substantial risk and is not suitable for all investors. Please assess your own financial situation and risk tolerance carefully before trading.
Data sources: Cboe Global Markets 2024 Annual Report, SIFMA Capital Markets Fact Book 2025, FIA MarketVoice, Traders Magazine, MIT Sloan academic research, University of Florida Warrington College of Business, OptionMetrics (as of May 2026).

Comments ()