Q1 2026: From Naked Puts to Vertical Spreads
ALAB gapped down 8% overnight. The 160P blew past my strike — a −$758 loss that wiped out multiple winning trades. That single event triggered a complete framework shift: every new position from March onward became a vertical spread with defined max loss before entry. 13 spreads. 13 wins.
A real account of how ALAB's -$758 gap-down loss triggered a complete shift from naked short puts to defined-risk vertical spreads — and why the spread scorecard speaks for itself.
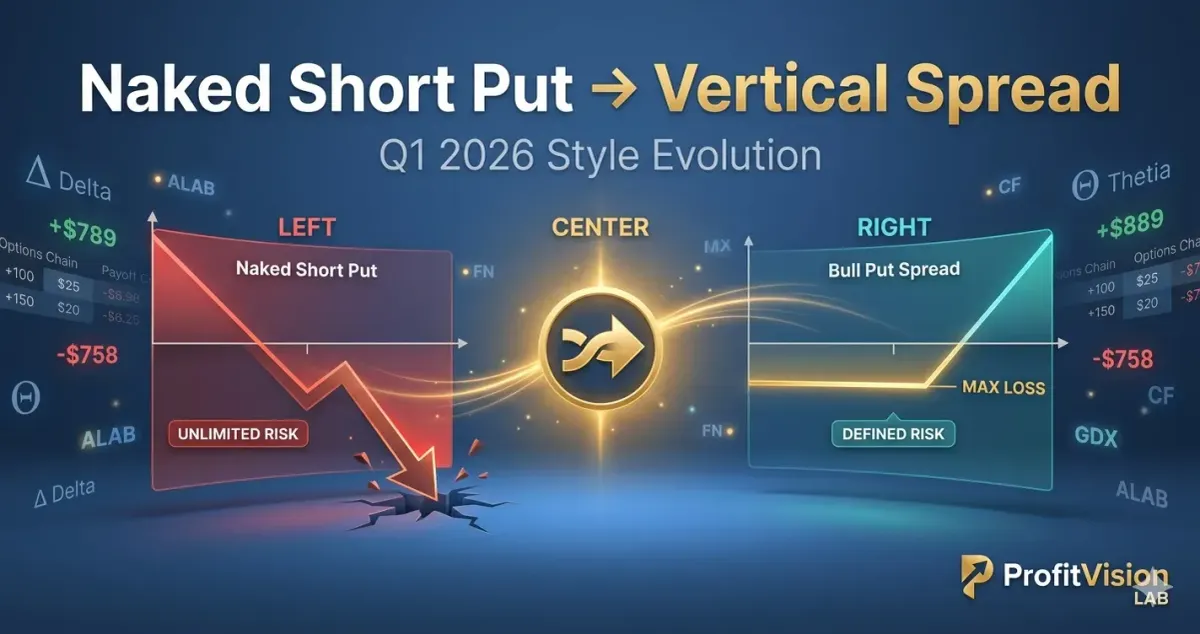
There are two fundamentally different modes of options selling: Naked Short Puts, where you sell a put with no downside protection and face theoretically unlimited risk; and Vertical Spreads, where you simultaneously buy a lower-strike put to cap your maximum loss at a known number before you even enter the trade.
This article documents my trading style evolution during Q1 2026 — from a naked short put approach in January, to a vertically-spread-first framework by March — illustrated through six real trades across ALAB, CF, FN, GDX, ETN, and NET.
The Core Difference: Naked Put vs. Vertical Spread
❌ Naked Short Put (Old Way)
- Sell one put, no hedge
- Higher premium collected
- Unlimited downside risk
- A gap-down can blow past strike
- High capital requirement (Cash-Secured)
✅ Vertical Spread (New Way)
- Sell high-strike + buy low-strike put
- Lower net premium received
- Max loss = spread width − net premium
- Defined risk regardless of crash depth
- Lower margin, better capital efficiency
Phase 1: ALAB Naked Puts (January–February 2026)
Astera Labs (ALAB) is one of the most volatile AI infrastructure semiconductor stocks of 2025–2026. In early January, I was selling naked puts to collect time value while the stock held elevated levels.
The wins: tight rolling worked
Between January 6–12, I ran two rounds on the ALAB 13FEB26 145P, entering and exiting quickly to capture time decay:
| Contract | Action | Dates | P&L | Note |
|---|---|---|---|---|
| ALAB 13FEB26 145P (Round 1) | Sell → Close | 1/6–1/7 | +$443 | Quick bounce, fast exit |
| ALAB 13FEB26 145P (Round 2) | Re-sell → Close | 1/7–1/12 | +$189 | Continued theta harvest |
| ALAB 20MAR26 140P | Sell → Close | 2/6–2/9 | +$311 | Stock recovered, clean exit |
The lesson: the 160P blowup
On January 5th, I sold the ALAB 06FEB26 160P at $10.67 per contract — a strike close to the market price, with high Delta. The next day, ALAB gapped down sharply. The 160P jumped to $18.25 and I was forced to take the loss:
| Contract | Sold At | Closed At | P&L | Note |
|---|---|---|---|---|
| ALAB 06FEB26 160P | $10.67 / contract | $18.25 / contract | −$758 | Gap-down, high Delta caught raw |
Naked puts aren't killed by slow declines — they're killed by gap-down events. When ALAB dropped 8%+ overnight, the Delta exposure overwhelmed every theta advantage I had built. If I had bought a protective long put below, the maximum loss would have been defined before the trade even opened.
The Pivot: Vertical Spreads from March Onward
From late February into early March, I restructured every new position as a vertical spread. The result wasn't higher absolute returns — it was a predictable risk ceiling. The following five cases cover March–April 2026:
Q1 2026 was not a normal market environment. Trump administration tariff announcements created sharp, unpredictable swings that made rigid profit targets impractical. Rather than mechanically waiting for 50% of maximum profit on every spread, I adopted a flexible, market-responsive exit framework.
Some positions were closed at 20% of max profit when conditions shifted; others were held to 50% when the underlying held support and volatility compressed. Three reasons this flexibility is the right call — not a compromise:
① Floating profit isn't realized profit. In a tariff-headline market, a 30% floating gain can reverse to a loss overnight. Locking in 20% and moving on isn't leaving money on the table — it's protecting money already earned. Don't fight with profits.
② Capital efficiency compounds across trades. Closing at 20% releases capital immediately for the next setup. Sitting in a position waiting for 50% while that capital is locked up means missing three other opportunities. Over a quarter, more closed trades at 20% can easily outperform fewer trades held for 50%.
③ Flexibility is the discipline in this environment. The rule isn't "always exit at 20%" — the rule is "read the market and exit at the right level for today's conditions." With Trump tariff risk unpredictable at every turn, mechanical rule-following is the real risk. Adaptive management is what keeps the edge.
Case 1: CF Industries (CF) — Bull Put Spread
CF is a major U.S. nitrogen fertilizer producer. Business tied to agricultural cycles makes support levels relatively predictable. I ran a Bull Put Spread with both legs below technical support.
| Expiry | Short Put | Long Put | Open | Close | P&L |
|---|---|---|---|---|---|
| 17APR26 | $120 (sell) | $115 (buy) | 3/12 | 3/27 | +$22.90 |
| 18JUN26 | $105 (sell) | $100 (buy) | 4/17 | 4/23 | +$128.77 |
CF Total: +$151.67 — Both rounds closed profitably. Max loss on each capped at the $5 spread width.
Case 2: Fabrinet (FN) — Five Rounds of Bull Put Spreads
FN is a precision optical component manufacturer. With stock price in the $490–$590 range, naked puts require enormous capital. Vertical spreads dramatically cut the margin requirement while keeping max loss fully defined. (→ FN Deep Research: AI Optical Networking Moat)
| Expiry | Short / Long Put | Open | Close | P&L | Result |
|---|---|---|---|---|---|
| 17APR26 | $530 / $520 | 3/3 | 3/10 | +$115.60 | Win |
| 15MAY26 (R1) | $440 / $430 | 3/17 | 3/20 | +$41.10 | Win |
| 15MAY26 (R2) | $480 / $470 | 3/26 | 3/27 | +$72.40 | Win |
| 15MAY26 (R3) | $450 / $440 | 3/30 | 4/8 | +$49.30 | Win |
| 18JUN26 | $590 / $580 | 4/16 | 4/23 | +$30.80 | Win |
FN Total: +$309.20 — Five consecutive wins, demonstrating the power of vertical spreads on high-priced stocks.
Case 3: GDX (Gold Miners ETF) — Riding Sector Momentum
Gold's strong run in March 2026 drove GDX higher. After confirming the trend technically, I ran a Bull Put Spread with strikes below support:
| Expiry | Short Put | Long Put | Holding Period | P&L |
|---|---|---|---|---|
| 15MAY26 | $75 (sell) | $70 (buy) | 3/20–3/23 | +$24.50 |
Single round. Held 3 days. With max loss defined upfront (spread width − premium), psychological pressure was minimal.
Case 4: Eaton (ETN) — Defensive Industrial Spread
ETN is an industrial electrical leader with strong fundamentals. During mid-March volatility, I built a defensive spread below the $330 technical support zone:
| Expiry | Short Put | Long Put | Holding Period | P&L |
|---|---|---|---|---|
| 01MAY26 | $340 (sell) | $330 (buy) | 3/16–4/8 | +$146.00 |
Case 5: Cloudflare (NET) — April Rebound Trade
Technical bounce signal appeared in mid-April. I chose NET (Cloudflare) for a Bull Put Spread participation:
| Expiry | Short Put | Long Put | Holding Period | P&L |
|---|---|---|---|---|
| 18JUN26 | $160 (sell) | $150 (buy) | 4/14–4/16 | +$57.46 |
Q1 2026 Vertical Spread Scorecard
By contrast, during the naked put phase (ALAB, Jan–Feb), the single largest loss was −$758 — requiring multiple successful trades to recover.
The Verdict: Discipline Is About Known Risk, Not Maximum Profit
Vertical spreads aren't more profitable per trade. They're more manageable. The three core advantages:
① You know your worst case before entry — no surprise blowups that wipe out weeks of gains
② Lower capital requirement — same account can hold more uncorrelated positions, diversifying risk
③ Quantifiable psychological risk — when max loss is $500, you can wait patiently for time decay to work
The −$758 single loss on ALAB 160P exceeded the total profit from every CF, FN, GDX, ETN, and NET spread combined. That one number drove the entire style change.
📊 Fabrinet (FN) Deep Research: AI Optical Networking Moat
📊 GDX Gold Miners ETF: Bull Put Spread for Sector Risk Management
📊 Cloudflare (NET) Top-Down Research 2026
📊 Hold and Collect Rent on AI Growth Stocks: TTD Three-Layer Options Strategy


Comments ()