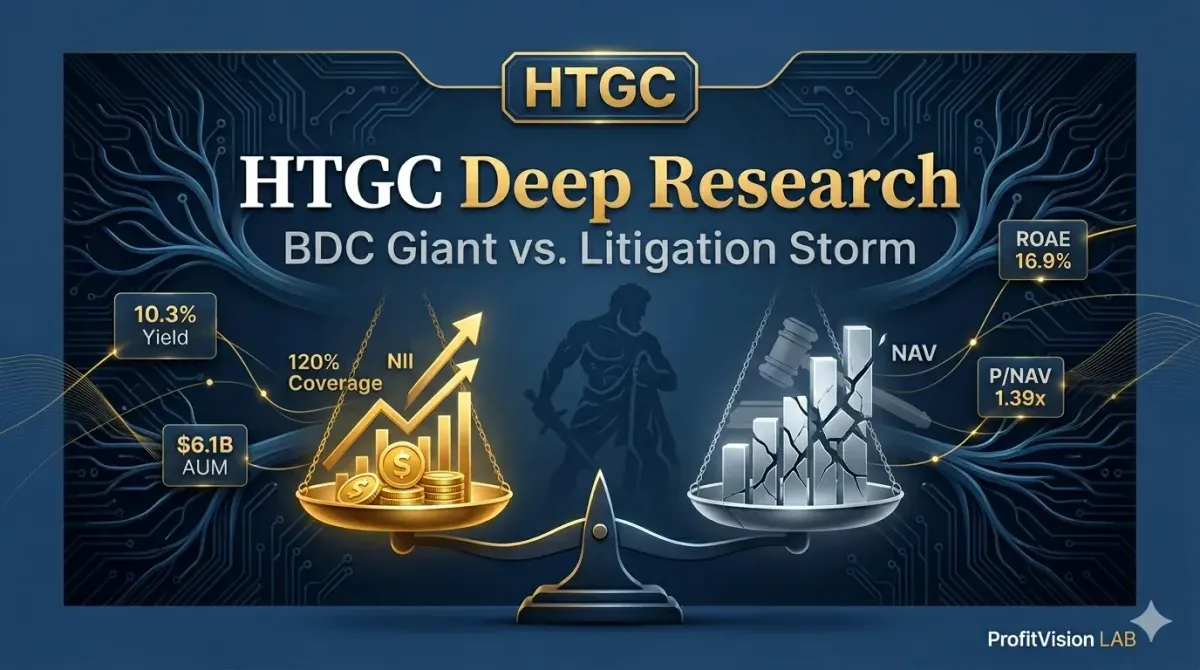
HTGC Deep Research: BDC Giant vs. Litigation Storm | Q1 2026 Full Analysis
Hercules Capital (HTGC): $6.1B AUM, 102% NII coverage, 16.9% ROAE, 10.3% yield — BDC sector leader facing three shareholder lawsuits. This analysis applies the Four-Layer Defensive Screen to weigh HTGC's moat durability against its legal cloud, with full Q1 2026 financial data.
📖 BDC Glossary — These Metrics Cannot Be Read Through a Standard Equity Lens
The BDC equivalent of "core EPS." Total interest and fee income minus operating expenses and interest payments. This — not GAAP net income — determines whether dividends are sustainable. GAAP net income includes unrealized mark-to-market swings that are meaningless for dividend analysis.
NII per share ÷ dividend per share. Above 100% means NII fully covers the dividend with a buffer. HTGC Q1 2026: 120% on the base dividend, 102% including the supplemental. Standard equity investors look at EPS; BDC investors look at Coverage Ratio.
Total fair value of all portfolio investments minus total liabilities, divided by shares outstanding. The BDC equivalent of book value. P/NAV > 1x means the stock trades at a premium to book. The critical caveat: NAV is management's own mark-to-market estimate, not an exchange-quoted price — the heart of HTGC's current litigation.
A borrower pays interest by issuing new debt instruments rather than cash. BDC records it as income, but no cash actually changes hands. Rising PIK concentration may signal deteriorating borrower cash flow — an early credit quality warning. HTGC Q1 2026 PIK: 9.1% of total income.
Cumulative NII that exceeded dividends paid and was retained rather than distributed. BDCs must eventually pay this out or face corporate tax. High spillover = ammunition for supplemental dividends. HTGC's current spillover: $149.9M ($0.82/share), funding the $0.28/share supplemental dividend.
Loans no longer accruing interest (typically 90+ days past due), expressed as a percentage of total portfolio at cost. Industry normal range: 1–3%. HTGC Q4 2025: 0.2% — suspiciously low, which is precisely one of Hunterbrook's allegations.
The BDC standard for measuring management efficiency — analogous to ROE but averaged across the period to smooth the impact of frequent share issuances. HTGC ROAE: 16.9% vs. ARCC's ~11%. Why ROAE not ROE: BDCs constantly dilute equity through new share issuance, making point-in-time ROE misleading.
The highest-priority debt structure. If a borrower defaults and liquidates, HTGC as first lien holder gets paid before all other creditors and shareholders. 93.6% of HTGC's portfolio is first lien — the structural credit protection anchor of the thesis.
The primary BDC valuation metric — equivalent to Price-to-Book for regular equities. P/NAV > 1x means the market pays a premium for management's ability to generate returns above book; < 1x signals distrust. HTGC at ~1.39x vs. ARCC at 0.93x — a premium that is simultaneously HTGC's greatest strength and greatest vulnerability.
GAAP total leverage = total debt ÷ net assets (all on-balance-sheet liabilities). Regulatory cap under the 2018 SBCA Act: 200% asset coverage (≈1:1 debt-to-equity) or 150% (≈2:1) for qualified BDCs. HTGC Q1 2026 GAAP leverage: 115.4% (up from 104.4% in Q4 2025) — elevated but well within the 200% regulatory ceiling.
Options to purchase equity in portfolio companies at a preset price, typically attached to HTGC's loans at origination. When a borrower IPOs or is acquired, HTGC exercises warrants for capital gains. This is the key differentiator between HTGC and plain-vanilla lenders — and the source of its historical return premium over peers.
A US tax designation allowing pass-through treatment: BDCs that distribute 90%+ of taxable income pay no corporate income tax — all income flows directly to shareholders, who pay tax individually. This structural feature is why BDC dividend yields run 8–13%. It's not that they earn extraordinary returns — it's that they're legally required to pass nearly all earnings to investors.
⚠️ Reading note: BDC analysis requires a fundamentally different framework from standard equity analysis. Applying P/E ratios, gross margin, or revenue growth metrics to HTGC produces meaningless conclusions. The correct analytical sequence for any BDC is: NII Coverage → NAV trend → Non-accrual rate → PIK concentration → P/NAV valuation. Everything flows from those five.
The Four-Layer Defensive Screen — Quick Reference
| Layer | Metric | Data | Result |
|---|---|---|---|
| Layer 1: Institutional Flow | Institutional ownership / liquidity | ~38% institutional, avg. daily vol ~3M shares | ⏸️ Watch (litigation overhang) |
| Layer 2: Economic Moat | ROAE / NII growth / scale | ROAE 16.9%, AUM $6.1B, sector leader | ✅ Pass |
| Layer 3: Volatility | IV / yield premium | 10.3% yield, IV elevated post-lawsuit | ✅ Favorable for premium sellers |
| Layer 4: Technicals | Price vs. 50-MA / post-event base | $16.56 near 50-MA, consolidating post-Feb 27 | ⏸️ Watch |
🎯 Verdict: Cautious Hold — fundamentals are intact but litigation remains unresolved. Wait for the Lead Plaintiff Deadline (May 19) and any SEC announcement before reassessing. For existing holders, selling Cash-Secured Puts in the NAV-discount zone ($11–12) to collect premium and reduce cost basis is the preferred tactical posture.
Chapter 1: Industry Map — What Is a BDC, and Where Does HTGC Sit?
1-1. The Legal Origin of the BDC Structure
A BDC (Business Development Company) is not a type of company — it is a specific regulatory and tax designation. In 1980, Congress passed the Small Business Investment Incentive Act, amending the Investment Company Act of 1940 (Sections 54 and 61) to create this category.
The policy rationale was straightforward: policymakers wanted to encourage growth of the venture lending ecosystem without locking out retail investors. BDCs were the solution — a structure that lets retail investors participate, through publicly traded shares, in the kind of middle-market and venture lending that was previously accessible only to private fund LPs.
To maintain BDC status, a company must satisfy three overlapping regulatory frameworks:
| Rule | Core Requirement | Consequence of Violation |
|---|---|---|
| 1940 Act Section 55 | At least 70% of assets must be invested in "Eligible Portfolio Companies" — primarily private US companies or public companies with market cap below $250M | Loss of BDC status; reverts to a closed-end fund |
| 1940 Act Section 61 | Must provide "significant managerial assistance" to portfolio companies | Same |
| IRC Subchapter M (RIC status) | Must distribute at least 90% of taxable net investment income annually (most BDCs distribute 98%+ to avoid any corporate tax) | Loss of pass-through treatment; double taxation kicks in |
The third rule is the structural engine of BDC dividends: by distributing nearly all income, BDCs become pass-through vehicles — like REITs for real estate, but for private credit. The company pays no corporate income tax; investors receive that income directly and pay tax at the individual level. This is why BDC dividend yields run 8–13% — the structure mandates it.
1-2. The BDC Business Model: Spread × Leverage
The BDC return engine reduces to a single equation:
BDC Return ≈ (Portfolio Yield − Cost of Debt) × Leverage + Warrant / Equity Upside
Breaking it down:
- Portfolio Yield (Asset Yield) — typically 10–14%. BDCs charge a premium because their borrowers cannot access conventional bank financing.
- Cost of Debt — investment-grade BDCs pay 4–6%; non-investment-grade pay 6–8%. BDCs fund themselves by issuing investment-grade bonds and drawing on bank credit facilities.
- Leverage — under the 2018 SBCA Act, qualified BDCs can operate at up to 2:1 debt-to-equity (150% asset coverage). Most BDCs run at 0.8–1.2x in practice.
- Warrant / Equity Upside — unique to venture BDCs: warrants attached to loans generate capital gains when borrowers IPO or are acquired.
This explains why rising interest rates are tailwinds for BDCs: nearly all BDC loans are floating-rate (typically SOFR + spread), so yields expand as rates rise, while much of their own debt is fixed-rate long-term bonds locked in at lower costs. The 2022–2023 Fed tightening cycle was the clearest demonstration of this mechanic in recent history — every major BDC's NII hit record highs.
1-3. The BDC Universe: Four Archetypes
| BDC Type | Borrower Profile | Typical Yield | Key Names |
|---|---|---|---|
| Large Diversified BDC | Middle-market buyouts, PE-backed companies | 10–11% | ARCC, OBDC, GBDC |
| Lower Middle Market BDC | SMEs ($10–100M revenue) | 10–13% | MAIN, PSEC, SCM |
| Venture / Tech BDC | VC-backed tech and life sciences | 12–14% | HTGC, TRIN, HRZN |
| Real Estate BDC | Commercial real estate debt | 9–10% | BXMT, ABR |
1-4. The Three Structural Risks Every BDC Investor Must Accept
First: 90% distribution mandate = no internal compounding. BDCs cannot retain earnings to self-fund growth — they must continuously issue new shares or debt. Dilution and rising leverage are not aberrations; they are features of the BDC model. Long-term BDC returns come almost entirely from dividends, not per-share earnings growth.
Second: NAV is management's self-assessment. BDC portfolios consist of private loans, warrants, and equity positions — none of which have exchange-quoted prices. Fair value is management's quarterly mark, audited but ultimately discretionary. If the market loses confidence in a BDC's NAV integrity, the stock re-rates to a deep discount almost immediately. HTGC's current litigation is precisely a challenge to NAV credibility.
Third: Concentrated credit cycle exposure. BDC borrowers — particularly venture-stage companies — default at much higher rates than investment-grade corporate bonds during recessions. In both 2008 and 2020, the BDC sector fell more than twice the S&P 500. HTGC's tech/biotech concentration amplifies this cycle sensitivity further.
HTGC occupies a unique niche: it is a tech/venture-cycle risk exposure packaged inside a BDC dividend structure. Investors seeking both venture ecosystem exposure and current yield have very few alternatives. But that position also means HTGC absorbs both BDC structural risk and venture-cycle beta simultaneously — a double-beta instrument hiding inside a "10% yield" label.
Chapter 2: Business Model and Economic Moat
2-1. The HTGC Portfolio — Four Dimensions
For a BDC, the portfolio IS the business — not products, not services, not market share. The HTGC portfolio can be analyzed along four dimensions: asset seniority structure, sector distribution, geographic concentration, and warrant/equity upside exposure.
2-1-1. Asset Seniority: 93.6% First Lien Senior Secured
| Asset Type | % of Portfolio (Fair Value) | Description |
|---|---|---|
| First Lien Senior Secured | 93.6% | Highest liquidation priority; paid first in default scenarios |
| Second Lien / Subordinated | ~3% | Limited allocation |
| Warrants | ~1.5% | Equity upside attached to loans |
| Direct Equity | ~1.5% | Strategic co-investments |
| Other | ~0.4% | — |
Two additional structural data points worth noting: 96.8% of the debt portfolio carries floating rates with contractual rate floors (typically SOFR + spread with a floor, e.g., 1.5% SOFR minimum), protecting yield even in a zero-rate environment. Average single-borrower exposure is below 1% of portfolio, with maximum concentration capped at roughly 3%.
2-1-2. Sector Distribution (Q3 2025 data; Q1 2026 shifts minor)
| Sector | % of Portfolio | Key Risk Exposure |
|---|---|---|
| Software / SaaS | 35% | SaaS valuation compression, AI disruption of legacy SaaS models |
| Drug Discovery & Development | 23% | FDA approval risk, clinical failure, biotech IPO window closure |
| Other Healthcare Services | 19% | Healthcare cost inflation, policy uncertainty |
| Consumer / Business Services | 10% | Consumer spending cyclicality |
| Fintech / Other Tech | ~8% | Regulatory risk, competitive pressure |
| Other (Energy, Media, etc.) | ~5% | — |
The concentration tells three stories. First, HTGC is not a diversified BDC — it is a tech/biotech BDC. Software + biotech + healthcare together account for 77% of the portfolio, far less diversified than ARCC or OBDC. Second, the 35% SaaS exposure is simultaneously the core opportunity and the core risk: AI disruption could undermine SaaS business models, but if SaaS companies leverage AI to deepen moats and expand ARPU, HTGC is among the first to benefit. Third, the 23% biotech allocation generates 13–15% loan yields but carries near-100% loss severity upon clinical failure — a high-IRR, high-volatility profile.
2-1-3. Warrant / Equity Upside Portfolio
As of Q1 2025: warrants in 98 companies, direct equity in 74. These positions represent HTGC's "venture fund within a BDC" — the return differentiator that has historically produced capital gains on top of interest income. Notably realized warrant exits have included Palantir (PLTR), Restoration Hardware (RH), Lightspeed Commerce, BlackLine, and Box. Two constraints bind this upside: realization timing is entirely dependent on IPO/M&A markets (2022–2023 saw this window close sharply), and regulatory limits on non-qualifying assets cap equity concentration.
2-1-4. Q1 2026 New Commitment Activity: All-Time Record
| Item | Q1 2026 | Notes |
|---|---|---|
| Total New Commitments | $1.81B | All-time single-quarter record; 56% in life sciences / tech |
| New Portfolio Companies | 16 | Net new additions to portfolio |
| Follow-on to Existing Borrowers | 12 | Add-ons to current portfolio companies |
| Actual Fundings | ~$700M (est.) | Commitments vs. actual draws; reflects borrower timing |
| Early Repayments | ~$150M (est., Q4 2025 data) | Borrower IPOs or refinancings; reduces NII |
Management attributed the record-setting origination to three factors: recovery in VC fundraising since H2 2024 driving borrower demand; the persistent void left by SVB's collapse in 2023 (bank venture lending has not fully recovered); and HTGC's March 2025 DBRS Morningstar BBB upgrade, which lowered its own cost of capital and expanded the deal size range it can competitively serve.
The critical counterpoint: record new commitments coincide directly with Hunterbrook's allegation that HTGC's deal sourcing is copied from public VC websites rather than proprietary pipeline. If even partially true, accelerating commitment volume may reflect looser underwriting rather than genuine deal flow strength. The credit quality impact of Q1 2026 originations will not be visible in non-accrual data for 18–24 months — watch Q3 2027 through Q1 2028 for the real signal.
2-2. Revenue Structure
HTGC's revenue breaks into three layers: interest income (~85–90% of total, the core engine); fee income (~8–10%, from origination fees, commitment fees, and prepayment fees); and realized/unrealized capital gains from warrants and equity (~3–5%). The portfolio is almost entirely senior secured, meaning HTGC holds the senior creditor position in any liquidation — a conservative structural choice relative to the high-yield nature of the underlying borrowers.
2-3. Three Sources of Economic Moat
- Scale economies: $6.1B AUM, $25B+ in cumulative commitments to 700+ companies over 22 years. This deal flow history is genuinely difficult to replicate on a short timeline.
- VC relationship network: HTGC has positioned itself as the largest venture debt provider to the VC ecosystem, with established relationships with Andreessen Horowitz, Sequoia, and other Tier 1 VCs. The deal pipeline derived from these relationships is arguably harder to replicate than the capital itself.
- Investment-grade credit ratings: DBRS Morningstar BBB (March 2025) and Fitch BBB (April 2025) give HTGC a structural cost-of-capital advantage over non-investment-grade BDC peers. At Q1 2026's 5.1% cost of debt, the spread to a 10–14% lending portfolio is meaningful.
2-4. Three Scenarios Where the Moat Breaks
First: if Hunterbrook's sourcing allegation is true, the VC pipeline relationship story collapses. VC firms route deals to HTGC because they believe HTGC brings proprietary underwriting value. If it emerges that HTGC is simply indexing Google Ventures' public portfolio page, referral flow from VCs would deteriorate materially.
Second: bank reentry into venture lending. First Citizens (which acquired SVB) and HSBC are both actively rebuilding venture debt books. Traditional banks carry cost-of-capital 200+ bps below BDCs — over a full credit cycle, that structural advantage matters.
Third: private credit fund competition. Apollo, Blackstone, and Ares have been aggressively moving into venture credit. Their fund structures allow them to accept lower yields on individual deals than a publicly traded BDC can. HTGC's competitive pressure in the $30M+ deal segment is increasing every year.
Chapter 3: Competitive Landscape
| Metric | HTGC | ARCC | MAIN | TRIN |
|---|---|---|---|---|
| Market Cap | $2.7B | $13B+ | $5B+ | $1.4B |
| AUM | $6.1B | $25B+ | $8B+ | $2B+ |
| Focus | Tech / Life Sciences Venture | Middle-market buyout | Lower middle market | Tech / Life Sciences Venture |
| ROAE (Latest Quarter) | 16.9% | ~11% | ~14% | ~14% |
| Forward P/E | ~9.1x | ~10.5x | ~12x | ~9x |
| Dividend Yield | 10.3% | 10.3% | 7% (monthly) | 13% |
| Price-to-NAV | ~1.39x | ~0.93x | ~1.6x | ~1.1x |
ARCC is not a true competitor — it operates in an entirely different market (middle-market PE-backed buyouts, not venture). Trinity Capital (TRIN) is the real comp: same venture tech/life sciences focus, smaller and younger, currently in high-growth mode. TRIN's 13% yield (vs. HTGC's 10.3%) suggests the market views TRIN as higher-risk — but TRIN is also the most credible near-term threat to HTGC's borrower relationships.
The less visible competitive threat: private fintech platforms (Brex, Mercury, Capchase, Pipe) that offer SaaS recurring revenue financing, directly displacing HTGC at the more commoditized end of its target borrower pool. These competitors don't appear in any BDC's quarterly filing, but they are consistently shrinking HTGC's addressable market at the smaller deal end.
Chapter 4: Financial Analysis — The BDC Four-Metric Framework
Standard equity analysis (gross margin, net margin, P/E, revenue growth) is not applicable to BDCs. The correct analytical framework requires four metrics: NII Coverage, NAV trend, Credit Quality, and PIK concentration. In that order.
4-1. NII and NII Coverage Ratio
NII is the BDC's "core operating EPS" — the cash available to sustain and grow the dividend after all operating costs are paid.
| Quarter | NII / Share | Base Dividend / Share | Coverage Ratio |
|---|---|---|---|
| Q1 2025 | $0.45 | $0.40 | 113% |
| Q4 2025 | $0.48 | $0.40 | 120% |
| Q1 2026 | $0.48 | $0.40 | 120% |
Three consecutive quarters above 113% coverage means HTGC is not just paying its dividend — it is accumulating Spillover ($149.9M, or $0.82/share), which is the direct funding mechanism for the $0.28/share supplemental dividend announced for 2026.
Full dividend coverage (including supplemental): 102%. Total Q1 2026 declared dividends were $0.47/share ($0.40 base + $0.07 supplemental). NII of $0.48 covers the full $0.47 — a coverage ratio of 102%. Even the supplemental payment is fully earned, not borrowed from reserves. Q1 2026 total investment income: $141.5M (+18.4% YoY, record high). Core investment income: $134.9M, also a record.
4-1-2. Q1 2026 Key Financial Metrics Summary
| Metric | Q1 2026 | Q4 2025 | YoY Change |
|---|---|---|---|
| Total Investment Income | $141.5M | ~$130M | +18.4% (record) |
| Core Investment Income | $134.9M | — | Record high |
| GAAP Total Leverage | 115.4% | 104.4% | +11ppt |
| Net Portfolio Growth | +$298M | — | Net expansion |
| Platform Liquidity | $454.5M | — | Ample |
| AUM | $6.1B | ~$5.7B | +21.8% YoY |
GAAP leverage rose from 104.4% to 115.4% in Q1 2026, driven primarily by the $1.81B new commitment surge expanding the asset base. At 115.4%, HTGC remains well inside the 200% GAAP leverage cap (150% asset coverage threshold under the SBCA Act). Platform liquidity of $454.5M — comprising undrawn credit facilities and cash — provides ample buffer for unfunded commitments and potential litigation costs.
4-2. NAV Per Share and NAV Trend
NAV is the BDC's book value — and unlike a manufacturing company where book value is relatively stable, BDC NAV fluctuates every quarter as portfolio fair values are remarked.
| Quarter | NAV / Share | QoQ Change |
|---|---|---|
| Q3 2025 | ~$12.30 | — |
| Q4 2025 | $12.13 | -1.4% |
| Q1 2026 | $11.90 | -1.9% |
Two consecutive quarters of NAV erosion — Q4's -1.4% and Q1's -1.9% — reflect increasing unrealized depreciation on portfolio marks. Management has attributed this to broader portfolio company valuation pressure, not specific credit events. But this trend intersects directly with Hunterbrook's thesis: if NAV marks are already gradually deteriorating even under management's own conservative assumptions, what does the portfolio look like under truly arm's-length valuation?
The other side of the coin: HTGC stock at $16.56 vs. NAV of $11.90 represents a 37% premium. ARCC trades at a 7% discount to NAV. The premium reflects the market's conviction that HTGC management generates returns well above book — a conviction that the current litigation directly challenges. If that premium compresses to parity, the downside from current prices is ~28%.
4-3. Credit Quality: Non-Accrual Rate and Internal Ratings
| Metric | Q4 2025 | Q1 2026 | Industry Benchmark |
|---|---|---|---|
| Non-accrual rate (at cost) | 0.2% | ~0.2% (est.) | 1–3% |
| Weighted avg. internal rating | 2.20 | — | — |
| Grade 1+2+3 (performing) | 98%+ | — | — |
| Grade 4+5 (watch/non-performing) | 1.5% | — | — |
On paper, HTGC's credit quality is exceptional — 0.2% non-accrual against a 1–3% industry benchmark is a significant outperformance. The Hunterbrook allegation is that this figure is the result of delayed grade-downs rather than genuine portfolio health. Whether Grade 4 loans that should be Grade 5 (non-accrual) have been held at Grade 4 to defer income recognition impact — this is precisely what an SEC investigation would examine.
4-4. PIK Income Concentration
PIK (Payment-in-Kind) replaces cash interest with new debt instruments. It is common in venture lending because early-stage borrowers often lack the cash flow to service debt entirely in cash. But rising PIK concentrations can mask deteriorating borrower credit quality.
| Period | PIK as % of Total Income |
|---|---|
| Full Year 2025 | 10.5% |
| Q1 2026 | 9.1% |
Management's Q1 2026 earnings call response to this: 91% of PIK is "by design" (contractually pre-specified in loan terms, not a reactive concession to borrower distress), and 98%+ of PIK income comes from Grade 1–3 (performing) loans. If true, the slight PIK elevation is a portfolio composition artifact, not a credit signal. The question — which a court discovery process could eventually answer — is whether "by design" and "by distress" are as cleanly separable as management claims.
Chapter 5: Valuation and Scenario Analysis
BDC valuation uses three metrics: Forward P/E, P/NAV, and Dividend Yield. Standard equity metrics (EV/EBITDA, PEG, Price/Sales) are not applicable.
| Scenario | Assumptions | NAV / Share | P/NAV | Implication |
|---|---|---|---|---|
| Bull | Hunterbrook allegations dismissed SEC declines to investigate NAV recovers in Q2/Q3 | $12.20–12.50 | 1.3–1.4x | Market maintains management premium; current 1.39x P/NAV holds or expands |
| Base | Litigation drags for a year, no material outcome NAV continues gradual erosion NII holds at $0.48 | $11.50–11.80 | 1.2–1.3x | Premium compresses toward peers; stock range-trades $14–15 |
| Bear | SEC opens formal investigation Partial Hunterbrook allegations confirmed NAV re-marked down 5–10% | $10.50–11.30 | 0.9–1.1x | Premium evaporates; stock re-rates toward NAV ($11–12); yield passively rises to 13%+ |
Current market pricing sits in the "slightly bullish base case" — $16.56 corresponds to ~1.39x P/NAV, implying the market still believes in HTGC's management premium. The fragility of that conviction is the defining risk of this position.
Chapter 6: Litigation Risk — A Standalone Deep Dive
6-1. The Hunterbrook Report: Core Allegations
On February 27, 2026, Hunterbrook Media (a firm that simultaneously publishes investigative reports and positions in the securities it covers) released "The Myth of Hercules Capital." HTGC stock fell 8% on the day of publication. The four core allegations:
- Deal sourcing plagiarism: HTGC's proprietary pipeline of potential investments is allegedly compiled by copying publicly available data from Google Ventures' portfolio page, rather than through genuine origination relationships.
- Inadequate due diligence: HTGC's investment team is undersized relative to AUM compared to peer BDCs, and underwriting rigor is insufficient for the credit risks being taken.
- Portfolio overvaluation: Certain holding marks exceed defensible fair value, implying NAV is overstated.
- PIK manipulation: Some PIK income classification may obscure actual borrower distress rather than reflecting contractual design.
6-2. Legal Timeline
| Date | Event |
|---|---|
| Feb 27, 2026 | Hunterbrook report published; HTGC stock -8% |
| March 2026 onward | Hagens Berman, Pomerantz, Faruqi, Gross, Rosen and others announce investigations |
| April 23, 2026 | Hagens Berman files formal class-action complaint |
| May 19, 2026 | Lead Plaintiff Deadline — critical calendar event |
| TBD | SEC formal investigation status: not publicly confirmed as of this writing |
Class period: May 1, 2025 – February 27, 2026. Any investor who purchased HTGC during this window and suffered losses is theoretically eligible to join.
6-3. Management's Response
On the Q1 2026 earnings call (May 5, 2026), management directly addressed several points: PIK is 91% by design; 98%+ of PIK is from performing (Grade 1–3) loans; Q1 2026 originations set an all-time record at $1.81B; NII coverage remains at 120%. What management did not address: the specific "Google Ventures copy" sourcing allegation. That silence will remain material until either SEC document discovery or legal proceedings force disclosure.
6-4. Scenario Probability Assessment
| Scenario | Estimated Probability | HTGC Stock Impact |
|---|---|---|
| SEC declines to investigate + lawsuit settles without major findings | ~50% | -5% to +10% (neutral-to-positive) |
| SEC opens investigation + litigation drags + NAV re-marks lower | ~35% | -15% to -25% |
| Material allegations confirmed + management changes | ~15% | -30% to -50% |
These probabilities reflect the LAB's current subjective assessment — readers must form their own view. The key insight for options sellers: the first two scenarios (85% probability combined) imply a maximum downside of approximately 25% from current levels. For premium sellers targeting the $13–14 strike range (near-NAV), the probability-weighted loss scenario is manageable — but this is not a position for investors who cannot tolerate the tail risk in scenario three.
Chapter 7: Tax Mechanics for Non-US Investors — The 11.5% Yield Is Actually ~10.8% After-Tax
This chapter addresses a specific and widely misunderstood question: for a non-US resident investor holding HTGC through a brokerage like IBKR, what is the actual after-tax dividend yield? The popular assumption — "30% withholding tax, so you net 70% of the dividend" — is significantly wrong for BDCs. Understanding why requires understanding how BDC distributions are classified under US tax law.
7-1. The Three Tax Categories of BDC Distributions
BDC distributions are not monolithic "dividends" for US tax purposes — they are classified into several categories, each with different withholding treatment for Non-Resident Aliens (NRA). HTGC publishes a Section 19(a) Notice and Form 1099-DIV each January reclassifying the prior year's distributions:
| Distribution Type | Source | US Tax Classification | NRA Withholding |
|---|---|---|---|
| Ordinary Dividend | NII (interest income passed through) | Ordinary income | 30% withheld |
| Qualified Dividend | Qualified dividends received by HTGC | Qualified dividend income | 30% withheld |
| Capital Gain Distribution | Long-term realized gains (warrants, equity sales) | Long-term capital gain | NRA typically exempt |
| Return of Capital (ROC) | Distributions exceeding distributable earnings | Non-taxable (cost basis adjustment) | 0% — no withholding |
The critical data point: HTGC's distributions have historically been 90%+ classified as Ordinary Dividend, because BDCs primarily earn interest income — not corporate earnings. This is counterintuitive to most investors who think of "dividends" as qualified stock dividends. HTGC's distributions are more accurately described as "passed-through interest income" in tax terms.
7-2. The 30% Withholding: What Actually Gets Deducted and When
The US imposes 30% withholding on US-sourced dividend income paid to NRAs. Since the US and Taiwan have no tax treaty, Taiwanese investors receive no preferential rate (compare: UK, Canada, Japan residents can access 10–15% treaty rates on qualifying dividends).
The operational sequence: (1) File W-8BEN at account opening to confirm NRA status (without it, backup withholding rates may be higher); (2) On each dividend payment date, the broker automatically withholds 30%; (3) In February–March of the following year, the broker issues Form 1042-S documenting total distributions and taxes withheld; (4) In March–May, IBKR automatically refunds a portion of the withheld tax — the step most investors miss.
7-3. The Refund Mechanism: Why BDCs Are Tax-Efficient for NRAs
The most common misconception about BDC investing for non-US investors is that the 30% withholding is the final tax cost. It is not — at least not at IBKR, and not for BDCs specifically. Here's why:
When BDC distributions are reclassified in the annual 1042-S, the portion attributable to IRC Section 871(h) Portfolio Interest — which covers interest income passed through from a BDC's loan portfolio — is generally exempt from US withholding for NRAs. This is the key structural difference between BDCs and regular dividend-paying stocks: a standard company's dividend comes from corporate earnings; a BDC's "dividend" is largely pass-through interest from its loan portfolio, which falls under the Portfolio Interest Exemption for NRAs.
Practical calculation for HTGC investors:
| Item | Amount |
|---|---|
| 2026 estimated total distributions | $1.88/share |
| Gross yield (at $16.56) | 11.5% |
| 30% withheld on payment date | -$0.564/share |
| Cash received on payment dates | $1.316/share |
| IBKR automatic refund in following year (~80% of withheld) | +$0.451/share |
| Net after-tax cash received | $1.767/share |
| Effective after-tax yield | ~10.8% |
The headline-to-after-tax difference is only 0.7 percentage points (11.5% → 10.8%) — not the 3.45-point drag that a naive 30% calculation would imply. Important caveats: the refund timing creates a cash flow gap of 3–9 months; the refund rate varies by year; and different brokers handle this differently.
7-4. Comparative After-Tax Yield by Asset Type
| Asset Type | Distribution Composition | Est. Refund Rate (IBKR experience) |
|---|---|---|
| BDCs (HTGC, ARCC, MAIN) | Mostly Portfolio Interest + ROC | ~80% refund of withheld tax |
| High-dividend ETFs (SCHD components) | Mostly Qualified Dividends | Minimal refund; effective cost ~30% |
| Covered call ETFs (JEPI, JEPQ) | Mostly ordinary income (premium) | Small to moderate refund |
| REITs | Ordinary + partial ROC | Moderate refund (depends on ROC %) |
| MLPs | Mostly ROC | High refund, but K-1 filing complexity |
7-5. Three Practical Implications for Non-US Investors
Implication 1: Calculate after-tax yield by distribution composition, not by headline rate. The blanket "30% withholding on US dividends" narrative dramatically overstates the true cost for BDC investors. HTGC at 11.5% gross is roughly 10.8% net — a very different investment decision than 11.5% × 70% = 8.1%.
Implication 2: Capital gains from US stocks are generally tax-free for NRAs. The US does not generally tax long-term capital gains realized by non-resident aliens. For Taiwanese investors, this creates a structural tax advantage in growth equities (pay 0% on capital appreciation) that does not exist for US domestic investors. The tax optimization logic is essentially the reverse of US investor strategy: US investors put BDCs in IRAs to avoid dividend tax; non-US investors already have capital gains exemption built in without any account structure.
Implication 3: Option premium income has favorable tax treatment for NRAs. Selling Cash-Secured Puts or Bull Put Spreads generates option premium that is generally treated as capital gains for NRAs — no withholding tax. Net receipt: 100%. Holding the stock directly nets approximately 94% after the BDC's effective 6% withholding. The gap is narrower than commonly assumed, but option selling still carries the advantage of: no capital lock-up during the full holding period; immediate cash inflow (vs. waiting 3–9 months for withholding refund); and strike price selection to manage effective cost basis.
Chapter 8: Conclusion and Tactical Recommendations
Core Investment Thesis
HTGC is a fundamentally strong BDC with a credibility problem. The financial metrics are genuinely impressive — 120% NII coverage, 16.9% ROAE, record originations. But unresolved litigation combined with a 1.39x P/NAV premium creates a "strong fundamentals, compromised narrative" setup that makes size-up positions inadvisable until the legal picture clears. Medium-to-long term, if litigation resolves without material findings, HTGC remains one of the highest-quality ways to gain venture ecosystem exposure with current yield.
Bull Case — Three Pillars
- Unassailable BDC leadership position: $6.1B AUM, $25B+ in cumulative originations to 700+ companies over 22 years. The VC relationship network is a genuine, durable asset.
- 120% NII coverage, sustained: Base dividend of $0.40 + supplemental of $0.07 = $0.47 total, 100% covered by NII. The 10.3% total yield is the highest among investment-grade BDCs.
- 16.9% ROAE — 54% above ARCC: This is not a temporary outperformance; it reflects a systematically higher-yielding portfolio structure (venture tech vs. middle-market buyout). The efficiency advantage is structural.
Bear Case — Three Pillars
- Litigation uncertainty is a non-quantifiable tail risk: SEC investigations and class-action suits do not show up in any BDC financial metric until they materialize — the financial statements look clean while the legal process is ongoing. This is the scenario where quantitative analysis breaks down.
- 1.39x P/NAV premium is a 37% cushion that can evaporate quickly: ARCC trades at a 7% NAV discount. The 44-point P/NAV gap between the two largest venture BDCs is entirely a function of management credibility — exactly what the litigation challenges. If credibility erodes, the re-rating is fast and painful.
- Two consecutive quarters of NAV erosion: -1.4% in Q4 2025, -1.9% in Q1 2026. The absolute amounts are small, but the direction is wrong, and the pace is accelerating. Sustained NAV erosion means NII growth is being offset at the portfolio level — real wealth creation is zero even if the income statement looks fine.
Options Tactical Structure
Covered Call writing is not the preferred strategy for HTGC (a 10.3% yielding stock — selling calls caps the upside that justifies holding through the litigation risk). The preferred structures:
| Strategy | When to Use | Suggested Structure |
|---|---|---|
| Cash-Secured Put | Want to add long-term exposure but at NAV-discount entry levels | 30–45 DTE, Strike $14 or $13 (NAV discount zone), Delta < 0.30 |
| Bull Put Spread | Neutral-to-bullish view, margin efficiency priority | Short $14 / Long $12, $2 wide, open when IV spikes on litigation news |
| Short / Bear position | Not recommended | Shorting a 10.3% yield stock means paying the dividend to the long — a structural headwind in any non-catastrophic scenario |
Upgrade / Downgrade Triggers
Upgrade to GO (any one of the following):
- 30 days past May 19 Lead Plaintiff Deadline with no SEC formal investigation announcement
- Two consecutive quarters of NAV stabilization or recovery
- P/NAV drops below 1.2x (stock price ~$14) — risk/reward becomes compelling for long-term holders
Downgrade to ABSOLUTE REJECT (any one of the following):
- SEC announces formal investigation
- Single-quarter NAV decline exceeds 5%
- CEO Scott Bluestein or CFO Mark Harris departs or faces personal charges
- Class-action settlement exceeds $100M (implies material merit in the underlying allegations)
Position Tracker
| Date | Event | Assessment | Outcome |
|---|---|---|---|
| 2026/05/05 | Initial coverage — Q1 2026 earnings | ⏸️ Cautious Hold | — |
Next scheduled update: Q2 2026 earnings (August 2026, est.)
Triggers for early update:
- SEC formal investigation announcement
- Post-May 19 Lead Plaintiff Deadline market reaction
- HTGC initiates internal audit or NAV restatement
- Material portfolio company default or IPO exit event
Sources: HTGC Q1 2026 Earnings Call Transcript, HTGC 2025 10-K, SEC EDGAR, Hunterbrook Media, StockAnalysis, Yahoo Finance, Zacks, public law firm lawsuit announcements, IBKR Activity Statement observations.


Comments ()