FIG (Figma) Q1 2026 Earnings Flash: AI Credit Monetization Inflection? Revenue Re-Accelerates to +46%
Figma delivers a blowout Q1 with accelerating growth, surging AI adoption, and a clear path to GAAP breakeven. Two hidden catalysts: the GAAP profitability unlock and AI compute deflation tailwind.
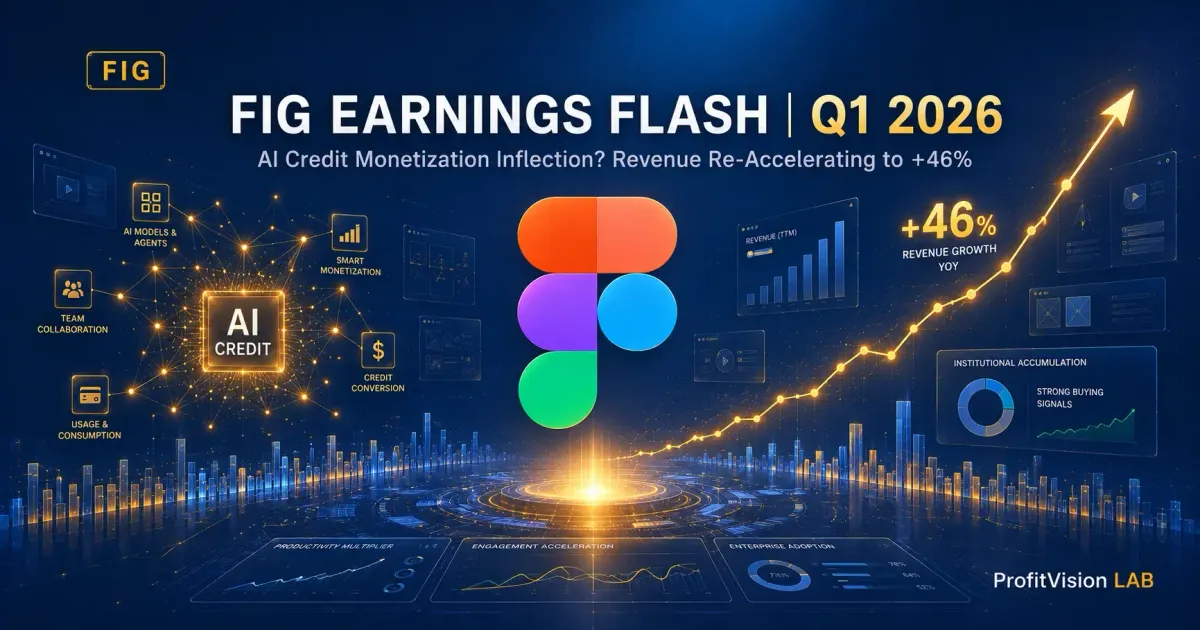
FIG (Figma) Q1 2026 Earnings Flash
AI credit monetization barely started and revenue already re-accelerated to +46% — is this the inflection point?
Figma Q1 revenue came in at $333.4M (+46% YoY), accelerating for the second consecutive quarter. Non-GAAP EPS of $0.10 beat consensus by 67%. Full-year revenue guidance raised by $55M to $1.422–$1.428B. Shares surged 16%+ the following day.
1. Key Financial Metrics
| Metric | Q1 2026 Actual | Consensus | vs Est. | vs Q4 2025 |
|---|---|---|---|---|
| Revenue | $333.4M | $316.3M | +5.4% | $303.8M (+40%) |
| YoY Growth | +46% | +38% | Accelerating | +40% → +46% |
| Non-GAAP EPS | $0.10 | $0.06 | +67% | $0.08 |
| Non-GAAP Op. Income | $52.1M | — | — | $44.0M |
| Non-GAAP Op. Margin | 16% | — | — | 14% |
| GAAP Op. Loss | -$137.4M | — | — | See trend below |
| GAAP Op. Margin | -41% | — | — | Improving fast |
| Operating Cash Flow | $97.3M (29%) | — | — | Incl. $56M bonus |
| Free Cash Flow | $88.6M (27%) | — | — | — |
GAAP Loss Trajectory: Converging Toward Breakeven
| Quarter | Revenue | GAAP Op. Loss | GAAP Op. Margin | SBC & Adj. | Non-GAAP Margin |
|---|---|---|---|---|---|
| Q3 2025 | $274.2M | -$1.10B | -415% | $1.14B (incl. $975.7M one-time IPO SBC) | 12% |
| Q4 2025 | $303.8M | -$195.5M | -64% | ~$240M | 14% |
| Q1 2026 | $333.4M | -$137.4M | -41% | ~$190M | 16% |
2. Customer Metrics: Broad-Based Acceleration
| Metric | Q1 2026 | Q4 2025 | Trend |
|---|---|---|---|
| Paid Customers | ~690K | ~450K (est.) | +54% YoY |
| Net Dollar Retention | 139% | 136% | +3pp, 2-year high |
| $10K+ ARR Customers | 15,218 | 13,861 | +37% YoY (accel. +5pp) |
| $100K+ ARR Customers | 1,525 | 1,405 | +48% YoY (accel. +2pp) |
| New Pro Team Conversions | — | — | +150% YoY |
| Figma Make Weekly Usage | 60% of $100K+ customers | 50%+ | ↑ |
| MCP Weekly Active Users | — | — | 5x QoQ |
| International Revenue | +48% YoY | — | Outpacing overall |
Every customer metric accelerated. NDR at 139% is a two-year high, meaning existing customers are purchasing more seats and AI credits. The 150% surge in Pro team conversions signals that AI features are pulling non-designers (engineers, PMs, marketers) into the Figma ecosystem.
3. AI Credit Monetization: Early Scorecard
Figma began enforcing AI credit limits on March 18 — meaning Q1 had only 13 days of actual monetization. Despite this, management disclosed compelling early signals:
3.1 Pricing Model
A dual-track approach: subscription-based AI credit add-ons and pay-as-you-go plans. Different features consume different credits — for example, Figma Make with default models costs 28–72 credits per generation, while premium models like Claude Opus consume more.
3.2 Early Retention Data
| Metric | Value | Significance |
|---|---|---|
| Org/Enterprise users who exceeded limits and continued consuming credits | 75%+ (as of April) | High conversion rate |
| Users who exceeded limits and stayed on platform | 95%+ (as of April) | Minimal churn |
| Pro teams with AI credit add-ons: avg. ARR vs those without | 3x+ | Heaviest AI users = highest-value customers |
3.3 Revenue Attribution
CFO Praveer Melwani was explicit: the Q1 beat was driven primarily by broader seat expansion, not direct credit revenue. AI served as a growth catalyst this quarter — pulling non-designers into Figma and indirectly boosting subscription revenue and NDR. Direct credit revenue contribution will become visible starting Q2, the first full quarter of enforcement.
4. Earnings Call: Key Quotes
CEO Dylan Field: Design as the AI-Era Moat
Field highlighted two customer case studies: (1) Google — designing next-generation agentic Gemini experiences end-to-end on Figma, with engineers now outnumbering designers on the platform; (2) NBBJ, a global architecture firm using Figma Weave to generate photorealistic renderings from 3D models, with Weave adoption expected to triple within three months.
CFO Melwani: Gross Margin Strategy
Q1 gross margin dipped to 82% (from 92% in 2024) due to rising AI inference costs. Rather than defending a rigid margin floor, management is focused on maximizing gross profit dollars through model routing across providers, leveraging a model-agnostic architecture, and investing in proprietary first-party models trained on Figma's design corpus.
On Competition
When asked about competition from large AI and cloud providers, Field acknowledged the design space will "continue to heat up," with some tools becoming complementary and others more directly competitive. He emphasized Figma's edge in deep understanding of designer workflows and the team's execution speed.
5. Updated Guidance (Raised Significantly)
| Metric | New Guidance | Prior Guidance | Change |
|---|---|---|---|
| Q2 Revenue | $348–$350M | Consensus $329.7M | +6% above consensus |
| FY2026 Revenue | $1.422–$1.428B | $1.366–$1.374B | +$55M |
| FY2026 Growth | ~35% | ~30% | +5pp |
| FY Non-GAAP Op. Income | $125–$135M | $100–$110M | +$25M |
| FY Non-GAAP Op. Margin | ~9% | ~8% | +1pp |
Note: Q2 operating income and free cash flow will be impacted by Config (Figma's annual user conference in June).
6. Analyst & Market Reaction
Price Action
Shares jumped 21% after hours and closed at $22.92 (+12.25%) the following day (May 15), with an intraday high of $23.93. Volume hit 76.45M shares — 4.5x the daily average of 16.92M — translating to an estimated $1.72 billion in dollar volume. With 441M shares outstanding, the single-day turnover rate was 17.3%. This is not retail-driven activity.
Five Signs of Institutional Accumulation
Signal 1: Options flow heavily skewed bullish. Call volume hit 30,666 contracts — 3x normal — with a call-to-put ratio of 7:2 and implied volatility rising 2 percentage points. Institutions were making leveraged bets on the upside through options.
Signal 2: 13F filings reveal pre-earnings positioning. UBS added 6.38M shares (+382%) in Q1, JPMorgan added 3.65M shares (+122%), and Viking Global initiated a 5.75M-share position. These are institutional bets placed before the earnings beat — post-beat, the logical move is to add, not reduce.
Signal 3: Massive analyst discount. Among 13 covering analysts, there are 4 Buys, 9 Holds, and 0 Sells, with a consensus target of ~$33.57 — implying 66% upside from $23. Institutions see this gap plus a comprehensive earnings beat and accelerate their accumulation.
Signal 4: Technical breakout confirmed. The close at $22.92 pushed above both the EMA(10) at $20.14 and SMA(50) at $21.31 in a single session. StochRSI reached 1.00 (maximum momentum). The volume bar was the largest green bar in three months — a textbook "high-volume breakout above moving averages."
Signal 5: Candlestick structure. Open $22.25, high $23.93, low $21.31, close $22.92. The lower shadow ($21.31 to $22.25) is longer than the upper shadow ($22.92 to $23.93), indicating aggressive buying at the lows. If retail were chasing, we would typically see a long upper shadow (gap-up-then-fade pattern). Today's candle showed the opposite: dip-buying with a close in the upper half. No signs of end-of-day distribution.
Analyst Price Targets (Pre-Earnings, Latest)
| Firm | Rating | Target |
|---|---|---|
| Morgan Stanley | Equal Weight | $38 |
| Wells Fargo | Overweight | $42 |
| Piper Sandler | Overweight | $30 |
| RBC Capital | Sector Perform | $31 |
| Stifel | Hold | $30 |
| BTIG | Neutral | — |
Most analysts had trimmed targets pre-earnings on Google Stitch competition and AI cost fears. The comprehensive beat likely triggers a new round of revisions.
7. Risks & Key Watchpoints
1. AI Competition? More Like Coopetition. The market frames Google Stitch and Anthropic Claude Design as Figma killers, but reality is far more nuanced. Figma's MCP is deeply embedded in the Claude, Cursor, and VS Code ecosystems — agents generate UIs that flow directly into Figma's multiplayer canvas. MCP weekly active users grew 5x quarter-over-quarter. That is symbiosis, not substitution.
If Claude Design were truly a Figma replacement, Anthropic would not meter it separately or charge independently — they would bundle it into the core product. The current approach looks more like experimentation than aggression. Moreover, what AI "designs" today — text-on-image social posts, basic wireframes — is nowhere near the complexity of real UI/UX design. Information architecture, user flows, interaction logic, brand consistency, accessibility standards — these require deep human expertise built over years. AI accelerates the craft; it does not replace it.
2. GAAP Losses Converging, but SBC Dilution Remains Real. GAAP operating margin improved from -64% in Q4 to -41% in Q1, with SBC declining ~$50M per quarter. Management expects this ratio to keep improving as pre-IPO equity grants amortize, revenue scales, and hiring stays disciplined. Whether GAAP breakeven arrives on schedule around 2027 is a key milestone to track.
3. AI Inference Costs: Near-Term Pressure, Long-Term Tailwind. Gross margin compressed from 92% (2024) to 82%, but AI compute costs are deflating at a breathtaking pace. Every major model provider — OpenAI, Anthropic, Google — is engaged in a brutal pricing war, with inference costs roughly halving every 6–12 months. Figma is a consumer of AI compute, not a supplier. It owns no data centers and hoards no GPUs. Its model-agnostic architecture lets it route queries to the cheapest provider at any given time. As compute costs fall: (a) gross margins recover naturally, (b) AI credit margins expand since customer pricing does not drop as fast, and (c) Figma can ship more AI features without proportionally increasing costs. AI compute deflation is Figma's single biggest hidden tailwind.
4. Q2 Is the Real AI Credit Test. Q1 had only 13 days of monetization. Q2 is the first full quarter. Credit utilization, add-on rates, and churn will be visible for the first time. Config in June could serve as either a catalyst or a disappointment.
5. Insider Selling Continues. CEO and multiple executives have been actively reducing their holdings — standard post-IPO lock-up behavior, but investors should monitor whether the pace intensifies.
Shiba the Disciplined's View
This was an unambiguous beat-and-raise quarter. Revenue acceleration, NDR at a two-year high, and AI adoption data that exceeded even the bulls' expectations. Figma is evolving from a design tool into what CEO Field calls an operating system for how software gets imagined, built, and refined — and the customer data is validating that vision.
Catalyst 1: GAAP Breakeven Unlocks a New Buyer Pool
GAAP operating margin narrowed from -415% (Q3 distortion) to -64% (Q4) to -41% (Q1), faster than the market expected. The quarter Figma achieves GAAP operating breakeven will be a major re-rating event. The logic is straightforward: most institutional valuation models rely on Non-GAAP, but GAAP losses prevent many value-oriented funds from including FIG in their investable universe. Once GAAP turns positive, a new pool of institutional capital suddenly "unlocks." At the current convergence rate, this could happen in 2027 — a clearly identifiable milestone for long-horizon investors to position ahead of.
Catalyst 2: AI Compute Deflation Is the Hidden Tailwind
The market worries about AI inference costs compressing Figma's margins. That concern misses the bigger picture: AI compute costs are collapsing at an unprecedented rate. Model providers are locked in a vicious price war with no sign of slowing. For Figma — an AI consumer with a model-agnostic architecture, not an AI supplier — this is pure tailwind. Margins recover, credit margins expand, and the company can ship more AI features without cost scaling proportionally. The CFO's stated philosophy of "maximizing gross profit dollars, not targeting a specific gross margin" reflects the confidence that the cost curve is moving in their favor.
Technical Picture: Stage 4 Testing a Bottom
FIG has fallen from its post-IPO peak of $142.92 to a low of $16.62. Technically, it remains in a Stage 4 downtrend with all long-term moving averages overhead. However, the $16–$20 zone is showing signs of bottoming, and this strong earnings report could serve as the catalyst for confirmation.
The key structural overhang is post-IPO lock-up selling pressure. The CEO and early investors have been steadily reducing positions — standard behavior, but it suppresses price. As this concentrated selling gradually exhausts, and with fundamentals continuing to exceed expectations, FIG has a credible path from Stage 4 through Stage 1 base-building — sideways consolidation, declining volume, converging moving averages — setting up for an eventual Stage 2 advance.
For current holders, this earnings report is a positive catalyst and an opportunity to improve positioning. For those on the sidelines, the right move is not to chase today's gap-up candle, but to patiently wait for a Stage 1 base to form: 6–8+ weeks of sideways action, sustained volume contraction confirming exhaustion of sellers, and the 10-week moving average flattening or turning up. Those are the signals.
The market belongs to those who survive the longest. This earnings report validates Figma's product. The stock needs time to repair its structure. Wait for the signal, not the narrative.
This article is an earnings flash report by ProfitVision LAB and does not constitute investment advice. All data sourced from Figma's official press release and earnings call transcript.
Author: Shiba the Disciplined | ProfitVision LAB

Comments ()