
Why Taiwanese Investors Should Know Overseas ETFs: Learn the Rules Before You Open the Menu
Taiwan's bond ETFs are plentiful, but its stock-side tools have a structural gap. This article explains the overseas ETF menu through asset allocation, fee compounding, tax cost, and ETF screening rules.
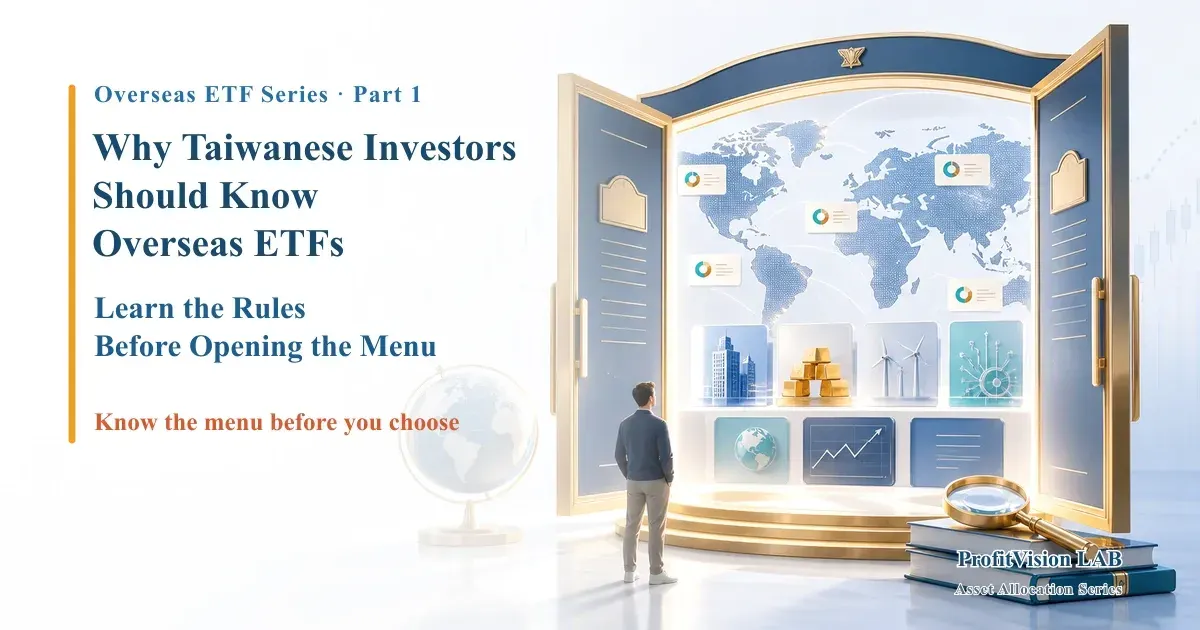
Taiwan's bond ETFs are plentiful, but its stock-side tools have a structural gap. The expense-ratio difference is a real drag under compounding, and the tax cost is misread far more often than it's overstated. This isn't a "go buy" piece — it's about learning the rules of the game before you sit at the table.
- Taiwan's bond ETFs are plentiful — that's not the gap; the real gap is on the stock side: factor ETFs (momentum, quality, small-cap value), global-ex-US diversification, and specific sectors are all very thin.
- The structural fee advantage of U.S. ETFs is badly underestimated — a 0.40% expense-ratio gap produces a terminal-value loss over 20 years far larger than most people's intuition.
- The tax cost of holding U.S. ETFs is badly overstated and mis-framed: a growth ETF (QQQ) loses just ~$150/yr per $100,000 to the 30% withholding; and Taiwan's own dividend tax (28% + 2.11% NHI) = 30.11%, virtually identical to the U.S. 30%. Tax is a cost, not a veto — but do the math.
- This series' logical order: build the screen → understand the cost → then get to know the tickers. Most investors do it backwards — drawn in by a theme first, then rationalizing the risk. That's the structure of systematic losses.
The hidden concentration problem in a Taiwanese portfolio
Before we talk about overseas ETFs, there's a question worth asking first: what risks is your portfolio actually exposed to right now?
A typical Taiwanese ETF investor's portfolio looks roughly like this: 0050 (Taiwan's top 50 by market cap) + 0056 or 00878 (high dividend) + one or two of the new active ETFs. On the surface it looks diversified, but open up the holdings and you find an unsettling fact:
- Country risk concentration: you hold 100% Taiwan-domestic assets, all facing the same geopolitics, currency, and business cycle.
- Sector concentration: in 0050, TSMC and the electronics names have long carried a combined weight above 70% — you're effectively making a huge bet on the semiconductor supply chain's prosperity.
- Currency risk concentration: every asset is denominated in New Taiwan dollars; if the TWD comes under sustained pressure, there's no hedge against the shrinkage.
This "the more familiar, the heavier we bet" tendency has a name: home bias — we systematically overweight the assets we think we understand and underweight the value of overseas diversification. It isn't unique to Taiwan; investors everywhere do it. The danger is that it makes people feel diversified while leaving them with no awareness of the risk they actually carry.
Plenty of people hold three or four ETFs and feel diversified. But open up 0050, 0056, and those one or two active ETFs, and the underlying is almost the same batch of Taiwan electronics names, carrying the same geopolitical and currency risk — you didn't buy four kinds of risk, you bought the same risk four times.
So getting to know overseas ETFs was never about Taiwan being a bad market. It's because putting all your eggs in one basket — no matter how pretty the basket — is itself an allocation problem.
Taiwan's ETF menu: where, exactly, is the gap?
Taiwan's ETF market has expanded fast in recent years, topping 300 listings by the end of 2025. But "many" and "enough" are two different things. Before we talk about the gap, one common misunderstanding needs clearing up: the gap isn't in bonds.
Taiwan's bond ETFs are actually abundant — U.S. investment-grade corporates, high-yield, Treasuries across durations, EM debt, aggregate bond indices, almost anything you can think of. On this front, Taiwanese investors aren't short of tools.
The real gap is concentrated on the stock side. So the table below uses stock ETFs as the comparison basis — and once you've read it, you'll see what's missing isn't quantity, it's the "dimension of strategy":
| Stock-side tool category | Taiwan today | U.S. market |
|---|---|---|
| Cap-weighted broad market (domestic) | Ample (0050, 006208) | VOO, VTI, SPY, etc. |
| High dividend (domestic) | Ample (0056, 00878, 00919, etc.) | DVY, VYM, etc. |
| Dividend growth (not high-yield — high-quality firms that raise dividends yearly) | Almost none | SCHD, VIG, DGRO — abundant choice |
| Factor ETFs / Smart Beta (momentum, quality, small-cap value, multi-factor) | Very few, mostly tracking domestic indices | AVDV, QUAL, MTUM, VLUE, etc. |
| Global-ex-US (international diversification) | Limited choice | VEA, IXUS, AVDV, etc. |
| Sector: defense / aerospace | None | XAR, ITA |
| Sector: cybersecurity | None | CIBR, HACK |
| Sector: nuclear / uranium | None | URA |
| Thematic with a 5+ year track record | Few; mostly new launches | BOTZ, PAVE, AIQ, etc. |
See it? What's missing isn't "one more Taiwan broad-market fund," it's the tools that let you run a different strategy. Want to use factor investing to harvest the small-cap premium or the value premium — excess-return sources that decades of academic work suggest persist over the long run? Taiwan's market has almost no pure tools to do it with. Want to diversify into "the whole world ex-US"? Just as hard to find. That's the real gap: not quantity, but dimension.
Expense-ratio gap: 0.4% sounds small — 20 years later it isn't
"U.S. ETFs are cheaper" is a line every intro article repeats, but few actually run the numbers. Let's do an explicit quantification:
approx. fee (0050 current)
(S&P 500 ETF) fee
(looks small)
Assumptions: initial NT$1,000,000, same pre-tax annualized return (8%), held 20 years, currency factor set aside.
0.03% fee tool (effective 7.97% annualized): terminal value ≈ NT$4.63M
0.43% fee tool (effective 7.57% annualized): terminal value ≈ NT$4.27M
Difference: ≈ NT$360,000 — about 36% of your initial principal, purely eroded by the fee gap under compounding.
Note: this is a pre-tax comparison and excludes FX costs and tax differences (see next section). The real picture is more complex and requires individual assessment.
This calculation makes one thing clear: the fee gap isn't a one-time loss, it's a structural drag that happens every year and compounds. For a long-term investor, that's not a small problem.
Of course, fees are only part of the story. A fuller comparison would be:
After-tax real return = asset growth − expense ratio − tax drag − FX cost
Once you fold the tax cost in, the numbers change qualitatively. That's the next thing to face squarely.
The tax cost: don't rush to fear that "30%"
"U.S. dividends get hit with 30% withholding" is the reason most people don't go abroad. But that number, on its own, means nothing — the 30% is multiplied by the yield. Times a 0.5% yield, and times a 3.5% yield, are two completely different things. Let's put the dollars on the table:
Growth ETF (e.g. QQQ): yield ~0.5% → annual drag after 30% withholding ≈ $150/yr (0.15%) — almost imperceptible.
High dividend (e.g. SCHD): yield ~3.5% → ≈ $1,050/yr (1.05%) — this is the part worth calculating.
What's even more counterintuitive: stay in Taiwan stocks, and the skin taken off is just as thick. A Taiwan high-dividend stock under the 28% separate-taxation option, plus the 2.11% NHI supplementary premium, totals 30.11%; the U.S. is 30% for a Taiwanese holder. The gap is just 0.11% — on the tax-rate front, the two sides are flat even.
Put it on the right scale: a growth ETF's 30% drag is just 0.15% — smaller than the 0.4% expense-ratio edge a U.S. ETF holds over a Taiwan ETF. By not going abroad to "dodge the 30% dividend tax," your savings don't even cover the extra fee you pay instead.
And not every "distribution" is withheld at 30% (long-term capital gain distributions and Return of Capital are 0%, BDCs refund 80–90% the next year), estate tax can be planned around with a joint account, and Taiwan's AMT threshold is one 99% of people never touch in a lifetime — Part 3 breaks down each of these mechanisms line by line. The point to remember first: tax is a cost, never a reason to buy or not buy; the real theme is the opportunity the U.S. offers that Taiwan's market can't.
Before opening the menu, learn three rules of the game
Having understood "why look abroad" (the tool gap) and "what it costs" (fee compounding + tax), the next step is "what standards to screen by." This series puts all three ahead of introducing any ticker — that order is deliberate.
Rule (1): The PVL screen — only what holds up to scrutiny gets in
The U.S. has more than 3,000 ETFs, with a very low bar to list; any theme can be packaged into an ETF. In that environment, screening discipline matters more than the choice itself. Every ticker in this series must pass these four checks:
| Screen criterion | Description & threshold | The logic behind it |
|---|---|---|
| (1) Liquidity | AUM typically above US$1 billion; ample daily volume (institutions often use this as an inclusion standard); tight bid-ask spread | An illiquid ETF sees its spread blow out under market stress — easy in, hard out; too-small AUM risks closure |
| (2) Long-term performance | Listed ≥ 3–5 years; ideally having survived the 2022 rate-shock bear; long-term return tracks or beats its peer benchmark | 2022 was the harshest rate shock since 1994; surviving it is a first test of a strategy's resilience; ETFs under 3 years old lack enough comparable data |
| (3) Reasonable cost | Expense ratio (TER) not markedly higher than same-strategy peers | The fee is the only certain negative drag — market returns are uncertain, the fee is always charged. A high-fee thematic ETF needs higher excess return just to break even |
| (4) Accessible to Taiwanese | Tradable via a compliant overseas broker (e.g. IBKR Pro, Firstrade) or domestic sub-brokerage | However good the tool, if you can't buy it, it's worth zero; some European UCITS ETFs have limited execution routes in Taiwan — confirm first |
Passing the screen means "worth knowing," not "worth buying." How much to allocate, and in what structure to hold, is a separate question to assess by your own situation.
Rule (2): The tax cost is a core variable in the return calculation, not a footnote
The tax impact varies by ETF type: a growth ETF (low yield) is barely felt; a high-dividend strategy (3%+ yield) is where it's really worth calculating. Ireland-domiciled UCITS ETFs can lower the dividend tax in certain cases, but they bring real costs of lower liquidity and wider bid-ask spreads — not a cure-all, and to be assessed individually. Part 3 breaks down every mechanism in full.
Rule (3): The access channel determines execution efficiency and compliance risk
Taiwanese have two routes to buy U.S. ETFs, each with structural pros and cons:
| Channel | Advantages | Disadvantages |
|---|---|---|
| Overseas broker (e.g. IBKR Pro, Firstrade) |
Low trading cost (IBKR Pro U.S. stocks ~$0.005/share); full toolset; SIPC coverage (limit ~US$500k); UCITS executable via IBKR in part | More complex onboarding; withdrawals require wire transfer (~$10–25/time); you organize your own tax data; more direct U.S. estate-tax exposure |
| Sub-brokerage (domestic bank or broker as agent) |
Simple onboarding; TWD in/out; tax data provided by the bank (but the filing duty still exists); covered by Taiwan financial-institution protection | Fees usually higher (0.5%–1% per buy/sell); some tools (e.g. UCITS) may be untradable; FX conversion done by the broker, with an opaque spread |
Note: the sub-brokerage's "easier taxes" refers to convenient data access (the bank provides statements); the filing duty is exactly the same as for an overseas-broker holder — overseas income above NT$1 million still requires AMT filing.
Part 2 of the series compares the two routes in full detail, including IBKR Lite (not applicable to Taiwanese) vs. IBKR Pro, Schwab (which has tightened onboarding for Taiwan residents in recent years), and the SIPC protection mechanism.
What this series teaches — and what it doesn't
Many overseas-ETF recommendation pieces are structured like this: "This ETF rose X% over the past five years, so you should buy it."
This series isn't structured that way.
Our order is: build the screening standards first → understand the tax cost first → get to know the nature and risks of the tool first → and only at the end talk about performance numbers. Because performance numbers are the most easily manipulated part — short-term high returns appear easily when markets are good, but whether it can survive a stress period, how much fees drag over the long run, and how much actually lands after tax are the real variables that shape long-term wealth.
"Knowing a tool" and "buying a tool" are two different things. The former is your duty, the latter is your choice. This series does the former.
Series Map
🗺️ The complete "ETFs Taiwan Can't Buy but the U.S. Can" series
- This part: why know overseas ETFs + Taiwan's precise gap + fee compounding + the tax framework + the PVL screen
- Access channels: overseas broker vs. sub-brokerage — cost, barriers, compliance compared
- ★ Tax, fully unpacked: which distributions are withheld at 30% and which aren't, the BDC refund, the practical estate-tax fix, a self-calc framework for AMT
- Core market: VOO / VTI / VT — fees, holdings, the benchmark trap
- International diversification & hedging U.S. concentration: VEA / IXUS / AVDV / IDVO
- Semiconductor ETFs: SMH vs. SOXX
- Defense & aerospace ETFs: XAR vs. ITA
- Biotech ETFs: XBI
- Thematic trends: BOTZ / AIQ / CIBR / URA / PAVE — a hot theme isn't a long-term winner
Rules first, tickers after. Next, we tackle the most practical execution question — as a Taiwanese, how do you actually get your money into U.S. ETFs, at what cost, and where are the risks?
Frequently Asked Questions
📚 Further Reading
- Overseas ETF (2): Overseas Broker vs. Sub-Brokerage — Cost, Barriers, and SIPC Protection Compared
- Overseas ETF (3): Which Distributions Are Withheld at 30% and Which Aren't — BDC Refunds, the Practical Estate-Tax Fix, and a Self-Calc Framework for AMT
- Prior series: Why Active Funds Lose to the Index Over the Long Run — Buffett's Bet and the SPIVA Report
Investing involves risk; past performance does not indicate future results. Overseas investing carries additional currency, tax, and geopolitical risk — assess carefully against your own finances and risk tolerance, and consult a qualified financial or tax professional where needed.
Tax figures used (U.S. dividend withholding for non-U.S. persons 30%, estate-tax US$60,000 threshold; Taiwan dividend separate taxation 28% plus 2.11% NHI supplementary premium, overseas-income NT$1 million threshold and NT$7.5 million basic-income-amount exemption) are as of mid-2026; exemptions and rates may be adjusted annually — verify the latest before relying on them. The detailed tax mechanics are in Part 3 of the series.

Comments ()