A Business Development Company (BDC) is a unique U.S. investment structure that, by law, must distribute at least 90% of its taxable income to shareholders as dividends. This creates a structurally high yield — not as a result of financial engineering, but as a legal requirement baked into the business model. In essence, a BDC is a licensed middle-market lender: it borrows at wholesale rates, lends to mid-size or growth-stage companies at a spread, and passes that spread back to you every quarter.
For options sellers, BDCs offer three structural advantages that make them unusually well-suited for Covered Call strategies:
① High dividends subsidize your holding cost — you're collecting cash every quarter whether or not you sell Calls;
② Muted stock behavior means Calls rarely get assigned — BDC price ranges are narrow, and OTM Calls expire worthless with high frequency;
③ Quarterly ex-dividend price drops naturally push price further from the strike — each dividend payment widens your OTM cushion for free.
Together, these three factors create a strategy where the odds are structurally stacked in your favor — as long as you've chosen the right companies and understand the timeline dynamics.
HTGC runs a two-tier dividend structure: a base quarterly dividend ($0.40) plus a supplemental distribution ($0.07 per quarter in 2025–2026), totaling $0.47. The supplemental component reflects excess pre-tax earnings from favorable rate environments in its tech lending portfolio — it is not permanently guaranteed. For conservative modeling, use $0.40 as the floor and treat the $0.07 as upside optionality.
The most common misconception about BDCs is this: "The stock price drops every quarter after the ex-dividend date, so it just treads water." This is only half the story. The ex-dividend price adjustment is a short-term accounting event. As long as the company keeps generating income and sustaining its dividend, the market quickly reprices the stock upward in anticipation of the next payment.
Measured by 10-year total return CAGR (dividends reinvested):
| Period | ARCC Total Return CAGR | HTGC Total Return CAGR | S&P 500 |
|---|---|---|---|
| 3 Years | 13.4% | 10.4% | ~14% |
| 5 Years | 14.4% | 11.3% | ~15% |
| 10 Years | 13.6% | 15.6% | ~13% |
The Numbers Behind the Growth
ARCC's share price moved from roughly $14–15 in 2015 to $19–21 in 2024–25 — a ~35–40% price appreciation over 10 years, or about 3% annually from price alone. Stack a ~10% annual dividend yield on top, and you're looking at a ~13% compounded annual return, neck-and-neck with the S&P 500.
HTGC went from approximately $11–12 to $17–19 over the same period — a ~50–60% price gain from the stock itself. Its higher ROE (~17%) gives it more explosive upside in tech-favorable cycles: in 2023 alone, HTGC's total return hit 46%.
This isn't "flat." It's a compounding cash flow machine that also drifts upward — and most investors never give it credit for the price appreciation layer.
The logic of selling Covered Calls on BDCs is straightforward: because prices don't tend to make explosive moves, OTM Calls expire worthless at a very high rate, effectively letting you harvest implied volatility as cash. Do this systematically every quarter, timed around ex-dividend dates, and you've built a two-engine income machine.
Set Call expiration dates 1–2 weeks after the ex-dividend date. After the dividend payment, the share price has already adjusted downward — your strike is now even further out-of-the-money, and assignment risk drops further. For ARCC: June 13 ex-div → September 13 ex-div → sell the September 18 $20 Call. The math takes care of itself.
| Parameter | ARCC | HTGC |
|---|---|---|
| Entry Price | $19.04 | $16.15 |
| Call Strike | $20.00 | $17.00 |
| OTM Buffer | +5.0% | +5.3% |
| Next Call Expiry | Sep 18, 2026 | Aug 21, 2026 |
| Implied Volatility | ~25–27% | 26.8% |
| Quarterly Premium Collected | $0.50 / share | $0.51 / share |
| Quarterly Dividend | $0.48 / share | $0.47 / share |
| Annual Cash Flow (pre-tax) | $3.92 / share | $3.92 / share |
| All-Cash Annualized Return | 20.6% | ~24.3% |
This 20–24% annual return is built entirely from cash flow — no price appreciation required. Factor in the gradual stock price drift of 3–5% per year, and the actual total return is meaningfully higher than the headline figure.
The U.S. imposes a 30% withholding tax on dividends paid to non-resident investors. Taiwan has no tax treaty with the United States, so the withheld tax cannot be reclaimed through Taiwan's tax authority. However, there is an important exception specific to BDCs:
A portion of BDC distributions originates from corporate loan interest (Interest income) rather than equity dividends. This component qualifies for the U.S. Portfolio Interest Exemption under the Internal Revenue Code — and is legally refundable. IBKR handles this refund automatically; you do not need to file anything with the IRS. The refund typically arrives in your IBKR account in January or February of the following year.
| Item | Amount (per share) | Notes |
|---|---|---|
| Dividend declared (pre-tax) | $0.48 | ARCC example |
| 30% withholding (deducted at source) | −$0.144 | Auto-deducted on payment date |
| Cash received (same day) | $0.336 | Hits account immediately |
| IBKR auto-refund (interest portion, Jan–Feb next year) | Varies by year | Portfolio Interest Exemption |
| Effective tax cost | Well below 30% | ARCC/HTGC historical refund rate: 60–90% |
Taiwan has no tax treaty with the U.S., so the 30% withholding cannot be reclaimed through Taiwan's tax system. However, the interest-income portion of BDC distributions is protected by the Portfolio Interest Exemption. IBKR processes this refund automatically — no IRS filing required — and deposits it in January or February of the following year. The effective tax cost is far lower than the headline 30% rate. Keep your W-8BEN form current (valid for 3 years; IBKR will remind you) — an expired form means losing refund eligibility entirely.
ARCC: 100 shares @ $19.04 · Call $20 · Quarterly premium $0.50 · Quarterly dividend $0.48
HTGC: 100 shares @ $16.15 · Call $17 · Quarterly premium $0.51 · Quarterly dividend $0.47
Margin: 1/4 down payment (ARCC $476 · HTGC $404) · 4.5% annual rate
Annual interest: ARCC $64.26 · HTGC $54.50 · Dividends after-tax ×97%
| Scenario | Position | Capital | Annual Div (AT) | Annual Call | Interest | Net Annual | Cash Yield |
|---|---|---|---|---|---|---|---|
| A1 All-Cash | ARCC 100 sh | $1,904 | +$186.24 | +$200 | — | $386.24 | 20.3% |
| A2 All-Cash | HTGC 100 sh | $1,615 | +$181.59 | +$204 | — | $385.59 | 23.9% |
| A1+A2 Combined (All-Cash) | $3,519 | +$367.83 | +$404 | — | $771.83 | 21.9% | |
| B1 Margin | ARCC 100 sh | $476 | +$186.24 | +$200 | −$64.26 | $321.98 | 67.6% |
| B2 Margin | HTGC 100 sh | $404 | +$181.59 | +$204 | −$54.50 | $331.09 | 81.9% |
| B1+B2 Combined (Margin) | $880 | +$367.83 | +$404 | −$118.76 | $653.07 | 74.2% | |
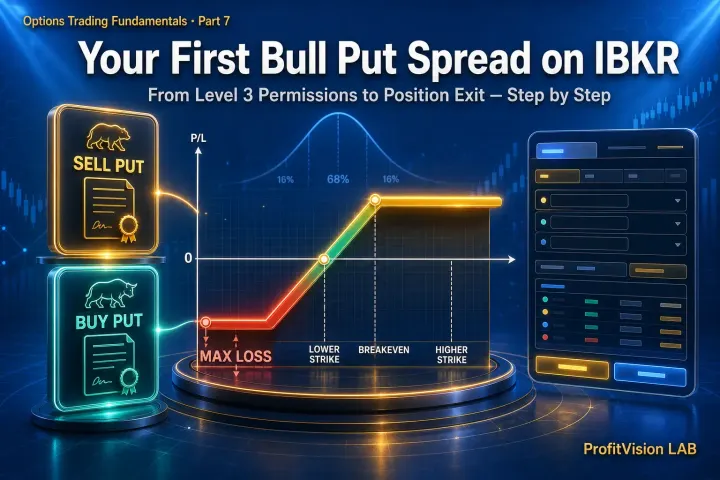
In this strategy, "breakeven" means something more interesting than the usual definition. It's the point at which cumulative cash inflows — dividends plus option premiums, net of margin interest — equal your total capital invested. From that moment on, the shares remain in your account at zero cost. Every subsequent dollar of income is pure profit on a free asset.
Quarterly net cash flow (after-tax, margin scenario):
| Item | ARCC (Qtr) | HTGC (Qtr) | Combined (Qtr) |
|---|---|---|---|
| Dividend (after-tax, ×97%) | +$46.56 | +$45.41 | +$91.97 |
| Call premium collected | +$50.00 | +$51.00 | +$101.00 |
| Quarterly margin interest | −$16.07 | −$13.63 | −$29.70 |
| Net quarterly income | $80.49 | $82.78 | $163.27 |
| Scenario | Capital In | Quarterly Income | Quarters to Breakeven | Timeline |
|---|---|---|---|---|
| B1 ARCC Margin | $476 | $80.49 | 5.91 qtrs | 1 yr 9 months |
| B2 HTGC Margin | $404 | $82.78 | 4.88 qtrs | 1 yr 5 months |
| Combined Margin Portfolio | $880 | $163.27 | 5.39 qtrs | ≈ 1 yr 7 months |
Quarter-by-quarter progress (combined margin portfolio · capital base: $880):
| Quarter | Cumulative Recovered | Remaining Cost | Progress |
|---|---|---|---|
| Q1 (3 months) | $163 | $717 | |
| Q2 (6 months) | $327 | $553 | |
| Q3 (9 months) | $490 | $390 | |
| Q4 (1 year) | $653 | $227 | |
| Q5 (1 yr 3 mo) | $816 | $64 | |
| Q6 (1 yr 6 mo) ✅ | $980 | Fully recovered |
Your $880 in margin capital has been fully returned by the strategy itself.
Both positions remain open. Every dollar of future income is profit on a zero-cost asset.
One more layer most investors miss: the gradual price appreciation of both stocks — roughly 3% per year for ARCC, 5% for HTGC — is not included in any of the above calculations. That's a free bonus that continues to compound quietly in the background.
| Dimension | ARCC | HTGC |
|---|---|---|
| Loan portfolio | Diversified middle market | Tech & biotech venture |
| Dividend stability | ★★★★★ Extremely stable | ★★★★ Stable + supplemental variable |
| Price behavior | Lowest vol · easiest Calls to sell | Slightly higher IV · richer premiums |
| 10-yr total return | ~13.6% CAGR | ~15.6% CAGR (higher) |
| Capital efficiency (ROE) | ~11% | ~17% (significantly higher) |
| Margin call threshold | ~$14–15 (−24%) | ~$12–13 (−23%) |
| Breakeven speed (margin) | 1 yr 9 months | 1 yr 5 months (faster) |
| Best suited for | Conservative, income-first | Moderately aggressive, higher return |
A combined ARCC + HTGC position is more than the sum of its parts. ARCC anchors the portfolio with the most stable income floor; HTGC delivers outperformance when technology lending cycles are favorable. Their price correlation is moderate (~0.51), providing genuine diversification. Under the margin scenario, total capital committed is just $880 — yet you control $3,519 in equity and generate $654 in annual after-tax income. The risk is calibrated; the structure is elegant.
As of early 2026, HTGC faces a securities class action lawsuit (plaintiff lead deadline: May 19, 2026) alleging the company copied a competitor's deal-sourcing process. The case has caused short-term price volatility. Based on available information, the long-term fundamental picture is not materially affected — but position sizing should reflect the ongoing legal uncertainty until the matter is resolved.
Time Is the Most Powerful Variable in This Strategy
The ARCC + HTGC Covered Call portfolio is a logically coherent, structurally sound, cash-flow-predictable system. It doesn't chase returns — it manufactures them, quarter by quarter, with dividends and option premiums working in parallel. All-cash yields 20–24% annually. Conservative margin amplifies that to 68–82%. With $880 in margin capital and about eighteen months of patience, the entire cost base is recovered — and the shares remain, generating income indefinitely on zero cost. The gradual price appreciation of both stocks is a bonus that compounds quietly on top. This is not a prediction. It's arithmetic, executed with discipline.
ProfitVision LAB · Shiba the Disciplined · "I teach you how to think, not just what to trade."


Comments ()