Stock Deep Dive
ProfitVision LAB · Options Selling · Stock Research · AI Investing
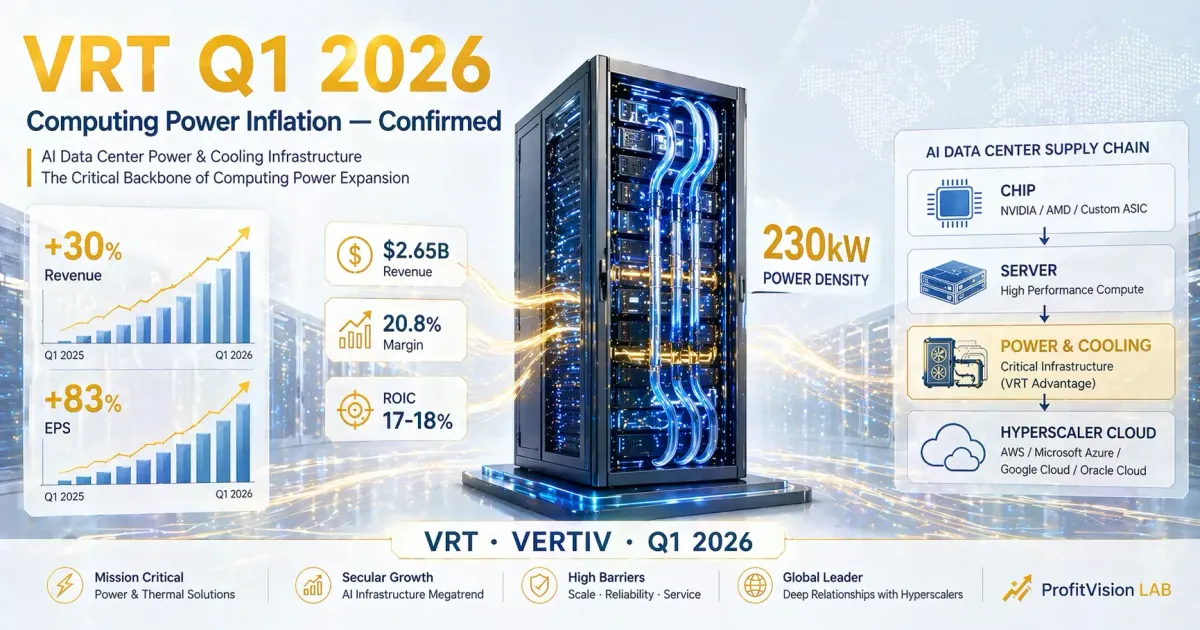
Core Thesis: Q1 2026 earnings formally validated our "computing power inflation × non-linear amplification" thesis. Revenue grew 30% YoY, adjusted operating margin reached 20.8% (+430bps YoY), and full-year guidance was raised again. Vertiv is not only selling more — it's selling at higher prices with tighter cost control. Yet the stock fell post-earnings as the market digests tariff headwinds and EMEA seasonality. This is not a thesis breakdown — it is normal volatility for a richly priced asset. Core watch stance unchanged; waiting for technical confirmation to enter.
🔍 Four-Filter Screener (2026.04.23)
| Filter | Metric | Data | Verdict |
|---|
| Filter 1: Institutional Sponsorship | RS Rating / Moving Average Structure | Price ~$272 (post-earnings); 50MA ≈ $232.8; 200MA ≈ $182.2. Price above both MAs; RS estimated 85–90 range | ✅ Pass |
| Filter 2: Economic Moat | EPS Growth / ROIC / SMR | Adj. EPS +83% YoY; ROIC ≈ 17–18%; FCF FY2025 $1.89B (+66%); Net leverage only 0.5x | ✅ Pass |
| Filter 3: Volatility | IV Rank | Post-earnings IV compression; estimated IV Rank ~20–30, below 50 threshold | ⏸️ Watch |
| Filter 4: Technicals | Price vs 50MA | $272 vs 50MA $232.8, +17%. Post-earnings pullback; need to monitor 50MA support hold | ⏸️ Active Watch |
🎯 Overall: Active Watch — Upgrade to Pass when IV Rank recovers to 40+ and price holds above 50MA
Chapter 1: Industry Map — The "Life Support System" of AI Data Centers
The complete supply chain of AI computing infrastructure extends from chip design to power distribution and thermal management, forming a highly vertically integrated industry stack. Vertiv sits at the very end of this chain — and the hardest link to bypass.
Chip Design
Layer 1: AI Chips
NVDA (H100/B200/GB200), AMD (MI300X), AVGO (Custom ASIC) → Power density surging; GB200 NVL72 rack reaches 230kW per cabinet
Chip Fab
Layer 2: Foundry
TSMC (N3/N2) → Process node shrink drives non-linear increase in power density
Server Assembly
Layer 3: Server OEM
SMCI, DELL, HPE → Assemble AI servers and deliver to data centers; cooling and power infrastructure sourced externally
VRT Position
🎯 Layer 4: Critical Infrastructure (Vertiv's Battlefield)
Power Management (UPS, PDU) × Thermal Management (precision cooling, liquid CDU) × IT Management Software (Trellis platform). 220,000+ installed customers globally.
Hyperscalers
Layer 5: End Customers
AWS, Azure, GCP, Meta → One hour of downtime per rack costs millions; VRT assumes the "SLA responsibility outsourcing" role
Market Size Estimate: Data center power and cooling market ~$45B in 2025, with projected CAGR of 10–14%. Liquid cooling sub-segment growing 25–40% annually, driven by accelerating GB200/Blackwell deployments.
📌 Chapter Takeaway: Vertiv's position is not "making chips" — it's "making chips run, stay cool, and stay on." As power density surges structurally, the per-unit pricing power of this position keeps rising.
Chapter 2: Business Model & Economic Moat
2.1 Q1 2026 Key Financials
+30%
YoY Growth (+23% organic)
20.8%
Adj. Operating Margin
+430bps
Margin Expansion YoY
| Region / Segment | Q1 2026 Revenue | Organic Growth | Notes |
|---|
| Americas | $1.81B | +44% | Broad-based strength across product lines; primary AI data center battleground |
| EMEA | $321M | −29% | Deferred reflection of prior order softness; not a structural decline |
| APAC | ~$350M (est.) | Mid-single digits (est.) | Includes China market; AI construction demand gradually recovering |
| Total | $2.65B | +23% | Beat company guidance by ~$56M |
2.2 Moat Assessment
| Moat Type | Vertiv's Specific Expression | Strength |
|---|
| System Complexity × Switching Costs | Integrated power + liquid cooling + software delivery; replacing VRT requires recertifying an entire architecture | 🔴🔴🔴🔴🔴 Very High |
| SLA Responsibility Outsourcing | Hyperscalers contractually transfer infrastructure downtime risk; VRT plays the "insurance underwriter" role | 🔴🔴🔴🔴🔴 Very High |
| NVIDIA Partnership | Co-developed liquid cooling reference architecture for GB200 NVL72; now an industry standard | 🔴🔴🔴🔴○ High |
| Global Scale & Certification | Service capability in 130+ countries; hyperscalers require global delivery and on-site maintenance | ���🔴🔴🔴○ High |
⚠️ Moat Threats: ① Schneider Electric closing the gap; ② Hyperscalers building in-house; ③ Rapid adoption of immersion cooling could force VRT to pivot.
📌 Chapter Takeaway: The core moat is the irreplaceability created by the combination of "integration capability × SLA responsibility × global delivery."
Chapter 3: Competitive Landscape
| Competitor | Primary Arena | Liquid Cooling Capability | Threat Level |
|---|
| Schneider Electric | Power + Cooling + Software | Moderate, actively building | 🔴🔴🔴 Medium-High |
| Eaton | Power (UPS-focused) | Weak, supplementing via partnerships | 🔴🔴○ Medium |
| Delta Electronics | Power / Rack PDU | Present but limited scale | 🔴🔴○ Medium |
| Huawei | Asia-Pacific data centers | Moderate; strong in China market | 🔴○○ Low (EMEA/Americas) |
📌 Chapter Takeaway: The real threat is not competitors taking market share — it's hyperscalers deciding to build in-house. This risk remains low for now.
Chapter 4: Financial Resilience
| Metric | FY2023 | FY2024 | FY2025 | FY2026E (Guidance) |
|---|
| Total Revenue ($B) | $6.90 | $8.01 | $10.23 | $13.75 (midpoint) |
| YoY Growth | +32% | +16% | +28% | +34% |
| Adj. Operating Margin | ~12% | ~17% | ~19% | ≥21% |
| Free Cash Flow ($B) | $0.78 | $1.14 | $1.89 | $2.20 (guidance) |
| Adj. EPS ($) | ~$1.8 | ~$2.9 | ~$4.6 | $6.30–$6.40 |
| Key Metric | Value | Interpretation |
|---|
| ROIC | ≈17–18% | Well above cost of capital; every dollar invested generates above-market returns |
| Net Leverage | ~0.5x | Extremely low; ample financial flexibility for acquisitions or buybacks |
| FCF Conversion | 110%+ | FCF exceeds net income; high-quality receivables |
✅ Highlights: Americas organic growth +44%; Adj. EPS +83%; full-year guidance raised again; tariff impact offset (price/cost positive).
⏸️ Concerns: EMEA organic −29%; stock declined post-earnings; FCF guidance not raised proportionally; Q4 2025 orders +252% creates a high base effect.
📌 Chapter Takeaway: Rock-solid financial structure; ROIC well above cost of capital; FCF at successive all-time highs.
Chapter 5: Valuation & Scenario Analysis
| Scenario | Core Assumptions | FY2026E EPS | Fair P/E | Implied Price Range |
|---|
| 🐂 Bull | AI capex accelerates; EMEA recovers; tariffs fully passed through | $6.50–$6.80 | 48–55x | $310–$375 |
| 📊 Base | Executes in line with guidance; EMEA moderately recovers in H2 | $6.30–$6.40 | 40–46x | $252–$295 |
| 🐻 Bear | Hyperscaler capex cuts; tariff escalation beyond management control | $5.40–$5.80 | 30–36x | $162–$209 |
📍 Current Pricing: Post-earnings ~$272, near the upper end of the base scenario. Continued beats could trigger re-rating; capex slowdown signals would push toward $209–$252.
📌 Chapter Takeaway: PEG ≈ 0.52; growth rate relative to current pricing remains reasonable. The core question is a binary bet on "whether AI capex continues."
Chapter 6: Conclusion & Tactical Recommendations
"Computing power inflation thesis validated by the numbers. As long as hyperscalers keep spending, VRT's pricing power keeps compounding. Active watch stance — waiting for technical confirmation before entering."
Bull Case vs Bear Case
| # | Bull Case | Bear Case |
|---|
| 1 | Backlog $150B+; visibility extends well beyond 12 months | Hyperscaler capex hits the brakes abruptly |
| 2 | Operating leverage accelerating: EPS +83% vs. revenue +30% | Tariff escalation beyond management's ability to offset |
| 3 | NVIDIA GB200 co-development creates deep structural moat | EMEA weakness extends longer than expected |
Options Strategy (Conditional — Not Immediate)
⚠️ Prerequisite: Current stance is "Active Watch." The following are pre-planned strategies to execute only once trigger conditions are met — not a current buy recommendation.
| Strategy | Strike Design | Entry Conditions |
|---|
| Bull Put Spread | Sell $240 Put / Buy $220 Put (8–10% buffer below 50MA) | IV Rank ≥ 40; price holds $260+; VIX < 25 |
| Iron Condor (Alternative) | Sell $310 Call / Sell $235 Put | IV Rank ≥ 45; price consolidating in a range |
Upgrade / Downgrade Triggers
| Action | Trigger Conditions |
|---|
| 🟢 Upgrade to "Pass" | Price reclaims $270+ and holds for 3 trading days; IV Rank recovers to 40+; positive EMEA order signals emerge |
| 🔴 Downgrade to "Watch / Reject" | Price breaks 50MA $232 without recovery; hyperscaler capex revision downward; management lowers full-year guidance |
📋 Tracking Log
| Date | Event | Judgment | Outcome |
|---|
| 2026/01/10 | Initial research: computing power inflation thesis established | ⏸️ Monitoring | — |
| 2026/04/22 | Q1 2026 Earnings: Revenue +30%, Adj. EPS +83%, guidance raised; stock declined post-report | ⏸️ Active Watch | Thesis validated |
| 2026/04/23 | This article published: Four-Filter Screener and valuation framework established for first time | ⏸️ Active Watch | — |
Next Update: After Q2 2026 earnings (expected July 2026)
Early Update Triggers: VRT breaks 50MA $232; major hyperscaler revises capex downward; company announces material order news
⚠️ Disclaimer: This analysis is for research reference only and does not constitute investment advice. Investing involves risk; please evaluate carefully based on your individual financial situation. Options trading carries high leverage characteristics and may result in total loss of premium paid. Data sources: Vertiv SEC Filings, StockAnalysis, Gurufocus, MarketBeat. Data as of 2026.04.23.

Comments ()