Reading Financial Statements ① The Three Statements: How the Income Statement, Balance Sheet & Cash Flow Interlock
A practical guide to reading financial statements: how the income statement, balance sheet, and cash flow statement interlock, and why investors need all three.
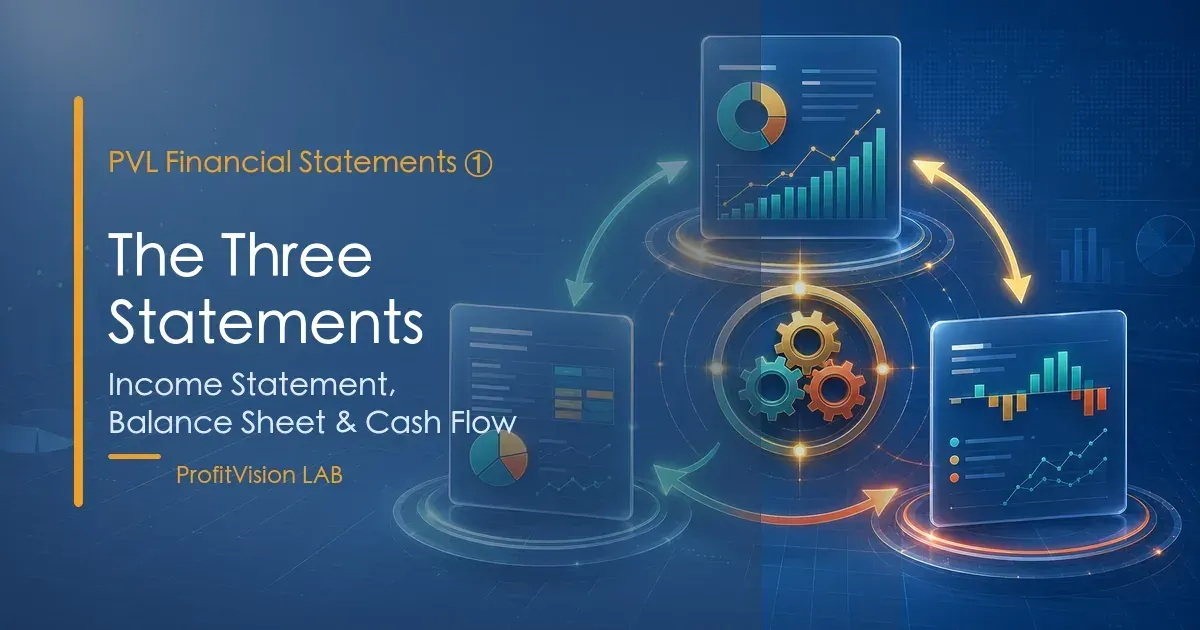
- A financial report is a three-part ensemble, not three independent documents. The income statement tells you "how much was earned," the balance sheet tells you "how deep the coffers runs," and the cash flow statement tells you "whether the cash actually came in" — leave out any one of them and you will be misled.
- The axis that links all three is the accounting identity A = L + E (Assets = Liabilities + Equity). Every single transaction moves two accounts at once. Master this identity and you can finally see what each move a company makes truly does to its statements.
- Every industry's financials look different. Across NVDA, TSMC, JPMorgan, Monster and Costco — five companies — even the line called "revenue" does not sit in the same place. That is exactly why this series teaches through five contrasting cases.
- The face of the statements gives you only the big-ticket items; the devil hides in the footnotes. The details that actually make you money or wipe you out are almost always written on those few pages of notes nobody reads.
This is the first installment of ProfitVision LAB's "Reading Financial Statements & the Notes — A Primer." Ten years ago, the very first financial-statements curriculum I ran for my investing club started right here. A decade later, the skeleton of the three statements has not changed by a single word — all that changes is the companies and the numbers. So for this revision I swapped the single example I used back then for five live companies drawn from completely different industries, so you can see clearly how the same skeleton supports five wildly different businesses.
Before we begin, let me lay out the two stances of this series — the standard posture a CPA or CFA takes when reading financials in practice. First, IFRS (International Financial Reporting Standards) is our backbone, with US GAAP for contrast. Taiwanese stocks and most international companies (including this series' TSMC) report under IFRS, while U.S. stocks (NVDA, JPM, MNST, COST) report under US GAAP; the two frameworks differ materially on revenue recognition, inventory valuation and the classification of financial assets, and I will flag the key divergences as we hit them. Second, what we read is not the "numbers" but the accounting judgment behind them — for the same transaction, how much discretion does the standard hand to management, and where is that discretion being used? That is the line that separates the professional from the amateur.
Here is the single most important sentence first: do not read the financial report as three separate documents. It is a three-voice ensemble — listen to any voice on its own and it will lie to you.
1. Three Statements, Each Answering One Question
Accounting compresses a company's operations into three statements. Each answers just one question:
| Statement | The question it answers | Nature in time | One-line analogy |
|---|---|---|---|
| Income Statement | Over this period, "how much was earned"? | A flow (accumulated over a period) | This month's paycheck minus expenses — what's left |
| Balance Sheet | Right now, "how deep is the coffers, how much is owed"? | A stock (a snapshot on a single day) | The balance and the loans you see when you open your account today |
| Cash Flow Statement | Over this period, "how much cash truly moved in and out"? | A flow (accumulated over a period) | The real credits and debits on your bank statement |
The difference between a "flow" and a "stock" is where beginners most often trip. The annual income statement is the result of summing all four quarters of the year; the annual balance sheet captures only the snapshot from the very last day of the year. One is "accumulated over the whole year," the other is "a single instant" — confuse them and you won't even be able to reconcile where the numbers came from.
And why must you read all three? Because they will contradict each other — and where they contradict is where the truth lives. When a company's income statement shows handsome profits while its cash flow statement bleeds for years, that crack is often the first sign of accounting fraud or a deteriorating business (precisely the theme of installments four and six in this series).
2. The Thread That Stitches the Three Together: A = L + E
No matter how many accounts a balance sheet contains, the single most central idea is one identity:
In plain terms: every resource a company holds (assets) can come from only two sources — money borrowed from others (liabilities), or money the shareholders put in plus earnings retained (equity). So the equals sign always holds: move the left side and the right side must move in lockstep. Let's walk through three of the most common transactions:
- Pay a $1,000 cash dividend: Assets (cash −1,000) = Liabilities + Equity (retained earnings −1,000). Each side falls by 1,000 — balanced.
- Issue $500 of long-term corporate bonds to borrow: Assets (cash +500) = Liabilities (long-term debt +500) + Equity. Each side rises by 500 — balanced.
- Spend $5 buying raw materials into inventory: Assets (cash −5, inventory +5) = Liabilities + Equity. A swap within assets; the total is unchanged — balanced.
Master this identity and you can "simulate" the financial-statement consequences of any move a company makes — buying a plant, borrowing, paying dividends, repurchasing shares, writing off bad debt — none of it escapes A = L + E. This is the inner discipline of reading financials, and the next four installments are all built on top of it.
Tying the statements out: where do they connect?
The three statements aren't written in isolation; they're locked together by a few "connectors":
- The income statement's "net income" → flows into the balance sheet's "retained earnings" (earnings not paid out accumulate into shareholders' equity).
- The income statement's "net income" → is simultaneously the first line of the cash flow statement (indirect method); from there you adjust downward for non-cash items to back out the real cash.
- The cash flow statement's "ending cash" → equals the balance of the "cash" account on the balance sheet.
In other words: net income shows up on the seams of all three statements at once. Precisely because of this, those who cook the books find it very hard to dress up one statement without leaving a tell on another — which is why a seasoned analyst always reads all three together.
The income statement tells you "how much was earned on paper," the balance sheet tells you "the coffers and the debt right now," and the cash flow statement tells you "how much real money actually landed in your pocket." These three are not written in isolation — they are stitched into a closed loop by two "connectors":
The first connector is "net income." Once it is computed on the bottom line of the income statement, it extends in two directions — one end accumulates into the balance sheet's "retained earnings" and becomes part of shareholders' equity (earnings not paid out thicken the coffers); the other end is the first line of the cash flow statement (indirect method), the starting point from which you adjust downward into real cash. A single net income figure simultaneously connects to the other two statements.
The second connector is "cash." After the cash flow statement runs through the three activities — operating, investing and financing — the "ending cash" it computes must exactly equal the balance of the "cash" account on the balance sheet — not a penny off.
So the three statements interlock end to end: net income stitches the income statement onto the "head" of the balance sheet and cash flow statement, and cash stitches the cash flow statement back onto the "tail" of the balance sheet. Precisely because they are locked into a single loop, if any one of them fails to tie out, either you made an arithmetic error or this company's books are haunted — and this is the hardest hurdle for anyone cooking the books: dress up one statement, and the other two will give you away. All three are indispensable.
3. Why Does Every Industry's Financials Look Different?
This is the myth this series most wants to shatter: there is no "one-size-fits-all financial-statement template." Two statements may both be called "income statements," yet their faces differ enormously across industries. Let's have our five protagonists introduce themselves; the next four installments will unpack them one by one:
| Company | Industry | Financial constitution in one line | What to watch most |
|---|---|---|---|
| NVDA Nvidia | IC "design" (fabless) | Asset-light, ultra-high gross margin (~71%), builds no fabs of its own | Inventory, purchase commitments, customer concentration |
| TSM TSMC | Wafer foundry | Extremely capital-intensive; "fabs" (PP&E) make up nearly half of total assets | Capital expenditure, depreciation, utilization rate |
| JPM JPMorgan | Bank | There is no "revenue − cost = gross profit" line | Net interest income, provision for credit losses |
| MNST Monster | Consumer beverages | Asset-light, almost no long-term debt, high-margin brand | Volume vs. price, the relationship with Coca-Cola |
| COST Costco | Retail / membership model | Thin gross margin (~11%), makes its money on membership fees | Same-store sales, accounts-payable leverage |
The most extreme contrast is NVDA versus TSMC — both are in semiconductors, yet their financials are two faces of the same mirror. NVDA spends just $6B of capex a year and rakes in $120B of net income (it outsources the grueling job of building fabs to TSMC); TSMC, by contrast, must pour $41B a year into building fabs to defend its process leadership. One is so light it could fly, the other as heavy as a mountain — this is the financial divide between "fabless vs. foundry," and we'll do the math for you in installments three and four.
What really catches beginners off guard, though, is JPMorgan. Open a bank's income statement and you'll find no "cost of goods sold" and no "gross profit." That's because a bank's business isn't selling things — it's "taking money in and lending money out, earning the spread in between." Its core profit engine is called Net Interest Income, and it carries an account that manufacturers don't have at all: Provision for Credit Losses — setting aside, in advance, losses for loans that may not be recoverable in the future. More counterintuitive still: on a bank's balance sheet, "deposits" are a liability (the bank owes you) and "loans" are an asset (others owe the bank).
So if you read a bank with habits built for manufacturing, the whole thing falls apart. The first lesson in reading financials isn't memorizing accounts — it's first asking: what kind of business is this?
What free financial-data sites give you (the downloads from Morningstar or Bloomberg) is almost always just the big-ticket numbers — and occasionally they get those wrong, too. But the key to understanding a company usually hides in the small line items of expenses and in the footnotes (notes to financial statements) — for example:
- How is revenue "recognized"? (Recognized on sale into the channel, or only on sale to the end customer?)
- What method values inventory? (FIFO vs. LIFO — under inflation, gross margin can differ by a wide margin.)
- Are there any related-party transactions done with "insiders"?
- That huge cash pile on the books — is it sitting in the company's own bank, or in an overseas account "held for you by someone else"?
These things you can't see on the face of the statements — installment six will use the blood-soaked cases of SVB, Enron and Wirecard to show you: skip the notes, and you'll be fine once, fine twice, but sooner or later you'll step on a landmine. Every installment in this series closes with this "Read the Notes" column, walking you through exactly which pages of footnotes that particular statement most deserves.
4. Where This Six-Part Course Is Taking You
Once the skeleton is built, the next five installments will add flesh to the bones, one piece at a time:
- ① The Three Statements (this piece) — establishing the inner discipline of A = L + E and how the three statements tie out.
- ② The Income Statement — reading from revenue all the way down to EPS, seeing NVDA's high gross margin and JPM's "no gross margin."
- ③ The Balance Sheet — the stock concept, the important accounts, turnover days; TSMC's heavy assets vs. Monster's zero debt.
- ④ The Cash Flow Statement — the defensive statement, the three activities, free cash flow; seeing how Costco "runs its business on suppliers' money."
- ⑤ Ratio Analysis — the four dimensions of growth, profitability, safety and efficiency + the DuPont breakdown + industry KPIs.
- ⑥ Tail Risk & Earnings Calls — the devil is in the details: seven blow-up cases + how to mine a company's true intent from earnings-call transcripts.
Finish these six and you won't become an accountant — but you'll own something far more valuable: when a financial report is placed in front of you, you'll know where to look, which two numbers to reconcile, and which page of footnotes to turn to. This is what I always say: I teach you how to think, not just what to do.
FAQ
Is it okay to read just one of the three statements?
No. The income statement can be fooled by "paper profits" inflated through accounts receivable; the balance sheet can't reveal earnings momentum; the cash flow statement can't reveal trends. The value of the three lies precisely in cross-validation: when paper profits look handsome while cash flow bleeds, that crack is exactly where you must stay alert.
Why is the accounting identity A = L + E so important?
Because it is the underlying logic of every change in the financials. Any transaction — borrowing, buying a plant, paying a dividend, a repurchase — moves both sides of the equation at once. Master it and you can simulate, in your head, the true consequence of an operating move on the statements, instead of rote-memorizing accounts.
Why do a bank's financials differ so much from an ordinary company's?
Because a bank's business is "earning the spread," not "selling things." So it has no cost of goods sold and no gross profit; its core is net interest income. And deposits are a liability to the bank while loans are an asset — the opposite of ordinary intuition. Before reading the financials, judging "what kind of business is this?" matters more than memorizing accounts.
All content is for research and educational purposes only and does not constitute investment advice. ProfitVision LAB is not a licensed investment adviser in Taiwan; all content reflects personal research and teaching based on public information, with no guarantee of accuracy or completeness. Companies and figures mentioned are teaching examples only, based on official filings, and do not constitute a buy/sell recommendation for any security. Investing involves risk; assess and bear responsibility yourself.
ProfitVision LAB · Shiba the Disciplined | I teach you how to think, not just what to do


Comments ()