The Data Verdict: Don't Let "Tax Savings" Become a Ceiling on Your Profits — SPMO Momentum vs. Tax Efficiency in Practice
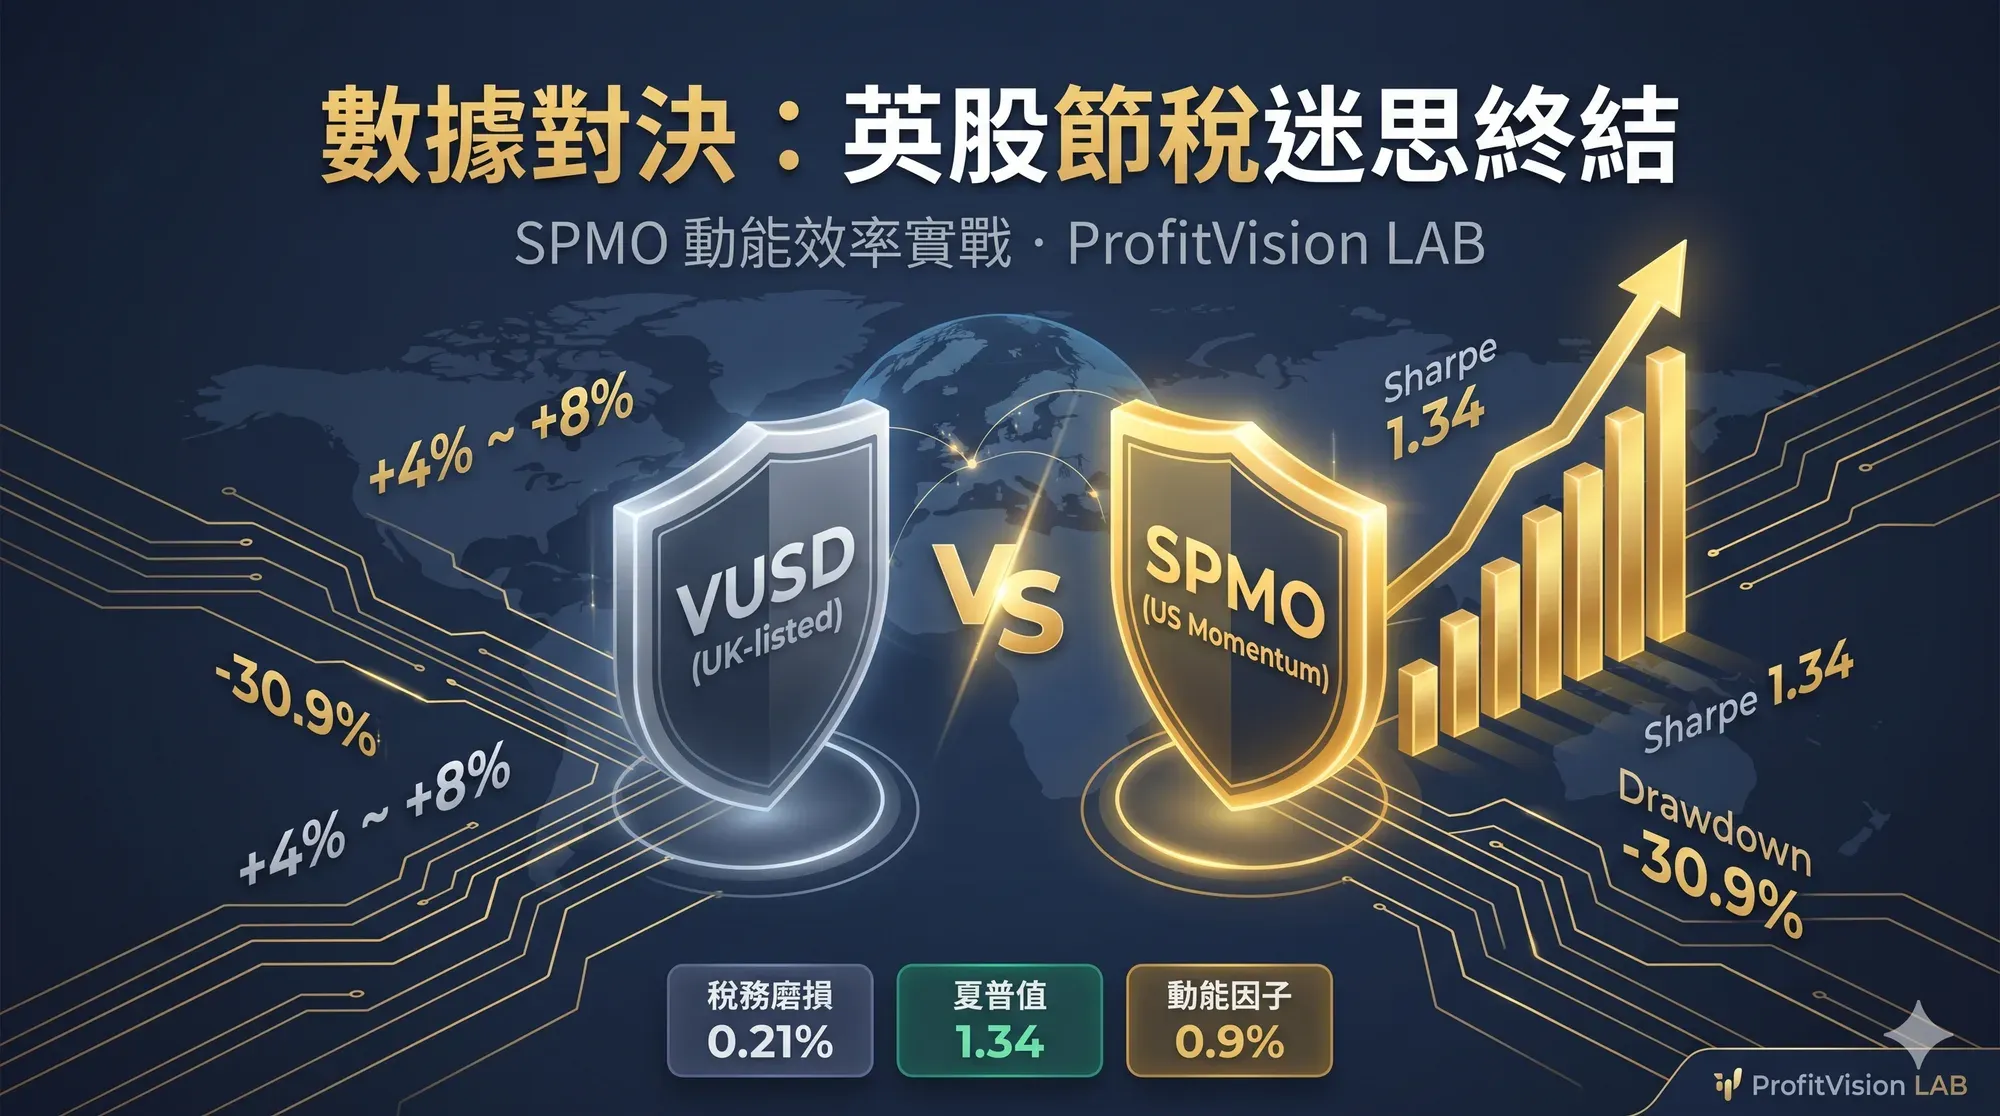
Do non-US residents really need UK-domiciled ETFs to save on taxes? Using hardcore data through year-end 2025, we put VUSD, VOO, and SPMO head-to-head on tax drag and actual returns. The result is striking: SPMO's tax drag is identical to VUSD's, yet it delivers 4–8% more excess return per year, with a higher Sharpe ratio and a smaller maximum drawdown. Saving a little is finance. Making a lot is business.
For the past two years I have walked a lonely research path. While most investors in personal-finance communities still treat "non-US residents must buy UK-domiciled (Ireland-registered) ETFs to save on taxes" as gospel, I chose to take a financial-analysis and project-management lens to this logic — deconstructing it, rebuilding it, and stress-testing it across multiple rounds with AI.
Today, using hardcore data through year-end 2025, we settle this head-to-head.
I. Three-Way Data Showdown: Who Is the True Profit King?
We line up three vehicles that all track the S&P 500 (or a factor variant of it) side by side: VUSD (UK/Ireland-domiciled ETF), VOO (US total-market ETF), and SPMO (US momentum-factor ETF).
| Metric | VUSD (UK Total Market) | VOO (US Total Market) | SPMO (US Momentum) |
|---|---|---|---|
| Dividend Yield | ~1.4% | ~1.4% | ~0.7% |
| Withholding Tax Rate | 15% (Ireland treaty) | 30% (no treaty) | 30% (no treaty) |
| Annualized Tax Drag | ~0.21% | ~0.42% | ~0.21% (identical to VUSD!) |
| 5-Year Annualized Return | ~15% | ~15% | ~19–23% |
| Expense Ratio (TER) | 0.07% | 0.03% | 0.20% |
SPMO's tax drag (0.21%) is exactly identical to the UK-domiciled VUSD (0.21%). SPMO concentrates on high-growth, low-dividend momentum stocks — so even though the US government levies a 30% withholding rate, the absolute drag ends up matching what VUSD pays at a 15% rate, simply because the dividend base is so small. With total holding cost essentially tied, the 4%–8% of additional excess return SPMO generates every year is pure, optimization-driven net profit.
II. Breaking the Bias: "High Growth" Does Not Equal "High Volatility"
There's a deeply entrenched bias in the investing world: that pursuing excess return requires enduring severe volatility. But when we pull up SPMO's and VOO's risk metrics side by side, the data will surprise even the "stability first" crowd.
| Risk Metric | VOO (S&P 500) | SPMO (Momentum Factor) | Conclusion |
|---|---|---|---|
| Beta (Market Sensitivity) | 1.00 | 1.02 | Essentially identical, highly synced to the broad market |
| Standard Deviation (Annualized Volatility) | ~13.0% | ~16.0% | SPMO slightly higher, but fully manageable |
| Maximum Drawdown | -34.0% | -30.9% | SPMO actually holds up better! |
| Sharpe Ratio | 1.15 | 1.34 | SPMO offers a better risk-reward ratio |
The Data Tells Us Three Things
① Beta of only 1.02: SPMO moves in close lockstep with the broad market — it is not some runaway speculative instrument.
② A smaller maximum drawdown: Thanks to its "automatically cull the weak, keep the strong" rebalancing mechanism, SPMO actually held up better during historical corrections — weak stocks are removed from the list before they ever get held.
③ A higher Sharpe ratio: You take on risk nearly identical to the broad market, but exchange it for higher profit efficiency. This isn't bias — it's data.
III. Logic Convergence: Where the Flow Goes, the Profit Follows
Flow is momentum. Where market capital flows is much like the trend signals of a search engine. SPMO re-screens for the top 100 stocks with the strongest momentum in the S&P 500 every six months — in essence an automated "asset optimization system." It doesn't try to predict the future; it reads the current inertia of capital.
Optimizing the conversion rate. The traditional total-market fund (VOO) is loaded with too many traditional companies whose growth has stalled. SPMO holds only the assets with the highest capital-conversion efficiency right now. No emotional baggage — just execution discipline.
Every six months it re-screens the S&P 500 for the top 100 stocks ranked by 12-month momentum, held at equal weight. During each turnover, stocks with fading momentum are automatically dropped — no human judgment required, the rules are the system.
IV. Conclusion: To Fellow Lonely Explorers
Core Conclusion
If you believe the US will keep grinding higher over the long run, what you need isn't a "tax-savings handbook" — it's a high-performance optimization system.
Saving a little is finance. Making a lot is business.
Stop capping the speed of your assets just to save a sliver of dividend tax.
At ProfitVision LAB, we choose the sharpest tools available, and take our full share of America's long-term growth dividend.
All content in this article is for educational and research purposes only and does not constitute investment advice or a solicitation to buy or sell. All data is as of December 2025. Past performance does not represent future results. Investing involves risk; please assess carefully based on your personal financial situation.
Think with me, not just trade with me.
© 2026 ProfitVision LAB · All Rights Reserved