CF Industries (CF) Deep Dive: Turning Natural Gas into a High-Cash-Flow Corporate Engine
CF Industries is more than a fertilizer stock. It converts natural-gas volatility into predictable, high cash flow, while getting ahead of the curve on the low-carbon ammonia transition. Its moat is built on a combination of scale, geography, and natural-gas infrastructure that is hard to replicate.
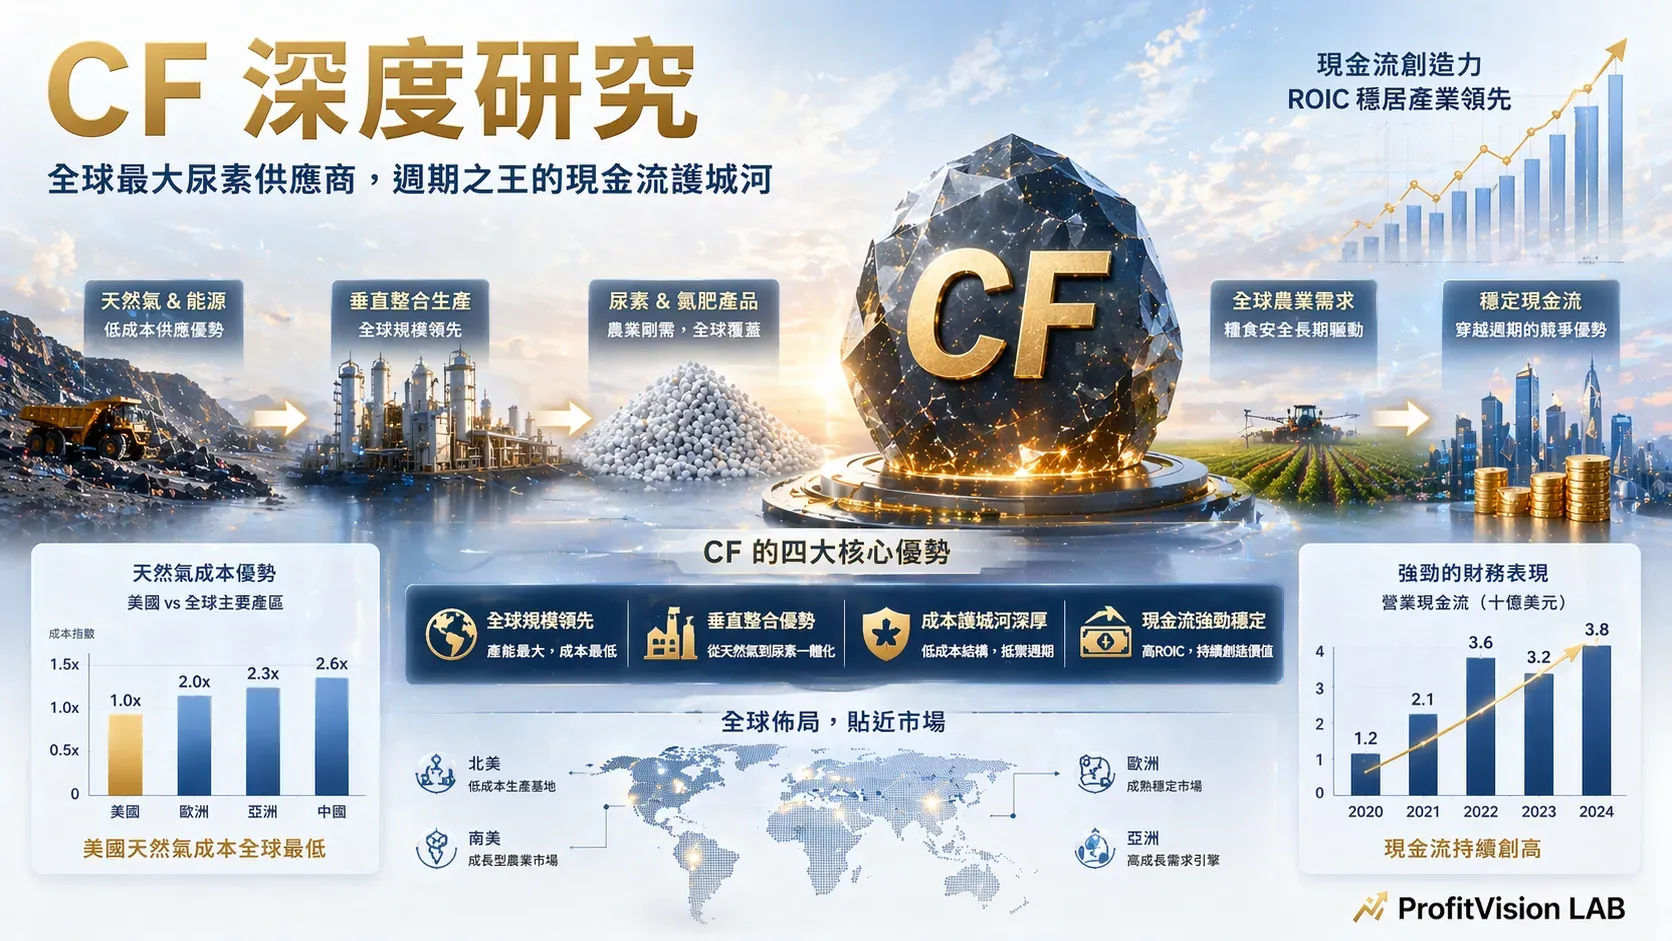
From the nitrogen fertilizer industry and business model to cost structure and low-carbon ammonia positioning, this piece breaks down why CF may not be an ordinary cyclical stock, but rather an industrial platform company with genuine long-term operating capability.
CF's core business isn't just selling urea, UAN, or ammonia — it has built a system that converts low-cost North American natural gas, through large-scale manufacturing, upgrading, logistics, and capital allocation, into a high-cash-flow enterprise. More importantly, it is trying to extend this ammonia platform — originally built to serve agriculture — into the much larger markets of low-carbon ammonia, the energy transition, and industrial decarbonization.
Researching CF shouldn't stop at "will fertilizer prices rise this year?" The real question is: does this company have the capability to weather the business cycle and extend a second growth curve?
Chapter 1: Industry Map
1.1 Asking the Right Question First: CF Research Starts With the Nature of the Business, Not the Stock Price
Viewed through the lens of a short-term trader, the focus on CF usually falls on nitrogen fertilizer quotes, natural-gas prices, war risk, supply-demand gaps, and whether this quarter's EPS beat expectations. But from a genuine corporate-research standpoint, the real question isn't "will this quarter's earnings be higher?" It's:
- What value is this business actually selling?
- Is the company's competitive advantage a gift from the cycle, or something it built itself?
- Is management running a commodity company, or an expandable platform?
- Over the next three to five years, will CF's growth curve simply track the fertilizer cycle, or has it already started extending to a higher level?
1.2 Nitrogen Fertilizer Industry Structure: Global Supply-Demand Landscape
| Dimension | Description |
|---|---|
| Core Uses | Agricultural nitrogen fertilizer (primary), industrial chemicals, energy transition (emerging) |
| Main Products | Anhydrous ammonia, granular urea, UAN (urea ammonium nitrate solution), AN (ammonium nitrate) |
| Pricing Drivers | Natural gas cost (most critical), global food demand, seasonality, geopolitics |
| Main Competitors | Nutrien, Koch Fertilizer, Yara (Norway), Middle East / Russian imports |
| Basis of Competition | Delivered price is primary; low-carbon attributes, reliability, and service are secondary |
1.3 CF's Corporate Evolution: From a Cooperative to a Capital-Efficiency Focus
| Timeline | Key Milestone |
|---|---|
| 1946 | Founded as Central Farmers Fertilizer Company, owned by an agricultural cooperative |
| 2002 | Business model shift: from "guaranteeing supply" to "pursuing financial performance" |
| 2005 | IPO, completing dissolution of the cooperative structure, formally oriented toward shareholder returns |
| 2010 | Acquired Terra Industries, expanding its North American nitrogen fertilizer asset footprint |
| 2014 | Divested phosphate rock and phosphate fertilizer businesses, focusing on nitrogen manufacturing and distribution |
| 2015–2016 | Completed Donaldsonville and Port Neal expansions, increasing total capacity by about 25% |
| 2023 | Acquired the Waggaman ammonia plant |
| 2025 | Formed the Blue Point low-carbon ammonia joint venture with JERA and Mitsui (CF holds a 40% stake) |
Chapter 2: Business Model and Moat
2.1 What Is CF Actually Selling? On the Surface, Fertilizer — At Its Core, the Ability to Convert Ammonia
CF's core product is anhydrous ammonia. Through the Haber-Bosch process, the company combines nitrogen from the air with hydrogen refined from natural gas to produce ammonia, which is then further upgraded into granular urea, UAN, ammonium nitrate, and industrial products such as DEF, nitric acid, and aqueous ammonia.
Ammonia's diverse uses: agriculture (nitrogen fertilizer feedstock) → industrial emissions control → commercial explosives → industrial chemicals → future power generation, shipping, and steel decarbonization
2.2 2025 Sales Mix
| Product | Volume (thousand tons) | Net Sales | Share |
|---|---|---|---|
| Anhydrous Ammonia | 4,597 | $2.176B | 30.7% |
| Granular Urea | 4,109 | $1.781B | 25.1% |
| UAN (Urea Ammonium Nitrate) | 6,947 | $2.161B | 30.5% |
| AN (Ammonium Nitrate) | 1,327 | $0.421B | 5.9% |
| Other Products | 2,077 | $0.545B | 7.7% |
| Total | 19,057 | $7.084B | 100% |
2.3 Moat Deep Dive
In 2025, natural gas accounted for about 34% of the company's total production cost; full-year natural-gas consumption was roughly 350 million MMBtu. CF's plants can connect to multiple major natural-gas trading hubs, including Henry Hub in the U.S., AECO in Canada, and the National Balancing Point in the U.K.
Conclusion: CF converts North America's relatively favorable natural-gas cost, via industrial chemical processing, into high-value-added products that both agriculture and industry can't do without.
CF's North American facilities together account for roughly 40% of North American ammonia capacity, 41% of granular urea, 44% of UAN, and 19% of AN. Its flagship asset, Donaldsonville, is "the largest and most flexible ammonia production complex in the world," with 6 ammonia plants, 5 urea plants, 4 nitric acid plants, 3 UAN plants, and 1 DEF plant.
Even more important: switchable production flexibility — the ability to dynamically shift output among urea, UAN, and DEF, which enhances earnings resilience.
Logistics assets: about 5,000 leased rail tank cars; up to 13 towboats and 42 river barges; connection to the 2,000-mile Sunoco ammonia pipeline; 39 terminal and storage sites across the U.S., Canada, and the U.K.; total storage capacity of roughly 2.8 million tons.
CF has stitched plants, pipelines, railroads, river transport, ports, and terminal storage into a single network. Once built, any new entrant looking to replicate it would need to not only build plants, but rebuild an entire logistics network as well.
Chapter 3: Competitive Landscape
| Competitor | Position | Strengths | Weaknesses |
|---|---|---|---|
| CF Industries (CF) | North American nitrogen fertilizer leader | Scale, logistics network, natural-gas cost advantage, low-carbon ammonia positioning | Highly cyclical; natural-gas price risk |
| Nutrien (NTR) | World's largest agricultural retailer | Potash + nitrogen vertical integration; broad retail network coverage | Large but unfocused scale; nitrogen costs not as competitive as CF's |
| Koch Fertilizer | North American private producer | Flexibility of a private company; backing from Koch's capital base | No public disclosure transparency; limited expansion |
| Yara (Norway) | Global top three | European brand; low-carbon ammonia first mover | European natural-gas costs far higher than North America; limited competitiveness |
| Middle East / Russian Imports | Low-cost import competition | Extremely low natural-gas cost | Geopolitical risk; long shipping distances; tariff uncertainty |
Chapter 4: Financial Resilience
4.1 Customer Structure in a B2B Industrial Business
CF's main customers include cooperatives, retailers, independent fertilizer distributors, traders, wholesalers, and industrial users. Its largest customer, CHS, accounted for about 13% of consolidated net sales in 2025. CHS also holds roughly an 11% interest in CF Industries Nitrogen, LLC, and has long-term purchasing arrangements in place.
CF's competitiveness is closer to "industrial systems capability" than "product appeal." It thrives not because consumers love the brand, but because in an industry that is inherently highly competitive, price-transparent, and not lacking in substitutes, it can still position itself favorably through cost, scale, logistics, and execution.
4.2 Financial Performance (2025)
| Financial Metric | 2025 Figure | Interpretation |
|---|---|---|
| Net Sales | $7.084B | Multi-product line diversifies risk |
| Natural Gas as % of Production Cost | ~34% | Largest cost variable |
| Natural Gas Consumption | ~350M MMBtu | Key to North American cost advantage |
| First Low-Carbon Ammonia Sales | Completed, at a premium to conventional ammonia | European and African customers; premium pricing |
4.3 Recession-Resilience Assessment
- A sharp spike in natural-gas prices (natural gas is 34% of CF's cost base)
- Global oversupply of nitrogen fertilizer (China capacity expansion)
- Agricultural downturn (reduced planted acreage)
- Geopolitical impact (Russia/Middle East import competition)
- Flexible product-mix switching: dynamic adjustment among ammonia, urea, UAN, and AN
- Logistics-network cost advantage: reliable delivery capability makes customers highly dependent on CF during peak season
- Low-carbon ammonia premium: part of the business is beginning to break away from pure commodity pricing logic
- Proactive capital allocation: ongoing share buybacks + M&A expansion capability
Chapter 5: Valuation and Scenario Analysis
Low-Carbon Ammonia: Building the Second Growth Curve
Donaldsonville Carbon Capture Project: Total cost of about $200 million, enabling production of up to roughly 1.9 million tons of low-carbon ammonia annually on-site, and qualifying for the 45Q tax credit. The first batch of low-carbon ammonia sales was completed in 2025, sold at a premium to conventional ammonia to European and African customers.
Ownership: CF 40%, JERA 35%, Mitsui 25%
Location: Modeste, Louisiana
Timeline: construction starting 2026, production starting 2029
Cost: about $3.7 billion in construction costs + roughly an additional $550 million from CF for shared infrastructure
Scale: annual nameplate capacity of about 1.4 million metric tons; able to capture more than 95% of CO2 from the ammonia-production process
If the low-carbon ammonia transition succeeds, it will bring three changes:
- The product will no longer be valued purely on the fertilizer cycle, but will gain an additional layer tied to energy and industrial applications
- Its low-carbon attributes could earn the company a higher premium in policy-driven markets like Europe and Japan
- A business that was once highly cyclical nitrogen fertilizer could gradually grow a portion of structural growth business
Bull Case
Natural-gas costs remain low; strong global food demand drives up fertilizer prices; the low-carbon ammonia premium keeps widening; Blue Point becomes a meaningful revenue source after starting production in 2029; valuation rerates from pure cyclical stock toward platform company
Base Case
Fertilizer prices are moderate; natural-gas costs are stable; the low-carbon ammonia business contributes premium slowly; the company continues share buybacks; scaled cash flow is maintained; Blue Point proceeds on schedule
Bear Case
A sharp natural-gas price spike compresses margins; global fertilizer oversupply; a flood of low-priced Chinese exports disrupts the market; the low-carbon ammonia premium falls short of expectations; Blue Point is delayed or runs over cost
Chapter 6: Conclusion and Tactical Recommendations
A Management Perspective on CF's Business Model
CF's essence is a corporate engine that converts low-cost natural gas into high-demand nitrogen products, and then, through large-scale manufacturing, logistics networks, and upgrading capability, turns cyclical volatility into cash flow.
| Core Point | Explanation |
|---|---|
| Its core is not a single product, but ammonia | A conversion platform spanning agriculture, industry, and the energy transition |
| Its advantage isn't brand, but cost and systems | Natural-gas cost + large-scale manufacturing + logistics network |
| Its profitability isn't just about pricing | Production flexibility + delivery efficiency + product-mix optimization |
| It is extending into low-carbon ammonia | Donaldsonville CCS + the Blue Point joint venture |
Bull Case vs Bear Case
| Dimension | Bull Case | Bear Case |
|---|---|---|
| Fertilizer Cycle | Strong global food demand; high farmer planting intent | Oversupply; Chinese export disruption |
| Natural Gas Cost | North American Henry Hub prices stay relatively low | A sharp natural-gas spike compresses margins |
| Low-Carbon Ammonia | Premium widens; European policy drives demand | Green policy retreats; premium narrows |
| Options Strategy Note | Wait for a low-carbon-ammonia milestone event (Blue Point breaking ground) | Stay alert when natural-gas futures spike |
Core Investment Judgment
Is this a company capable of integrating its cost advantage, production scale, logistics moat, and low-carbon transition into durable long-term competitiveness?
As long as this thesis hasn't been broken, CF is more than just a story stock — it's a company worth researching long term and validating quarter by quarter.
A more precise way to put it: it's an industrial company grounded in a commodity industry, but with a tendency toward platformization.
Key Metrics to Track
- Henry Hub natural-gas futures trends (the most important cost indicator)
- Global nitrogen fertilizer spot prices (benchmark quotes like Urea Tampa)
- Low-carbon ammonia sales orders and premium levels
- Blue Point joint-venture progress (2026 groundbreaking timeline)
- 45Q tax-credit revenue recognition
- Full-year FCF and share buyback volume
Tracking Log
| Tracking Date | Core Metrics | Rating | Next Focus |
|---|---|---|---|
| 2026/03/23 | 2025 net sales of $7.084B; first low-carbon ammonia sales completed; Blue Point joint venture announced | Actively Researching | Management's capital-allocation capability (focus of the next article); Blue Point groundbreaking progress |
Understanding a company's business model is only the first step. The next article goes one layer deeper: even a company with strong production capacity and good positioning can turn a good business into a bad investment if management doesn't allocate capital well. We'll look at whether CF's real competitiveness also comes from management's capital-allocation skill.
Investing involves risk; please evaluate carefully based on your own financial circumstances.
Data sources: SEC filings, company financial reports, StockAnalysis, public data | This article is part of ProfitVision LAB's single-stock research series #CF, data as of 2026/03/23.