How I Used Claude's Three Tools to Complete a Deep Stock Research Report: Fabrinet (FN) as the Case Study
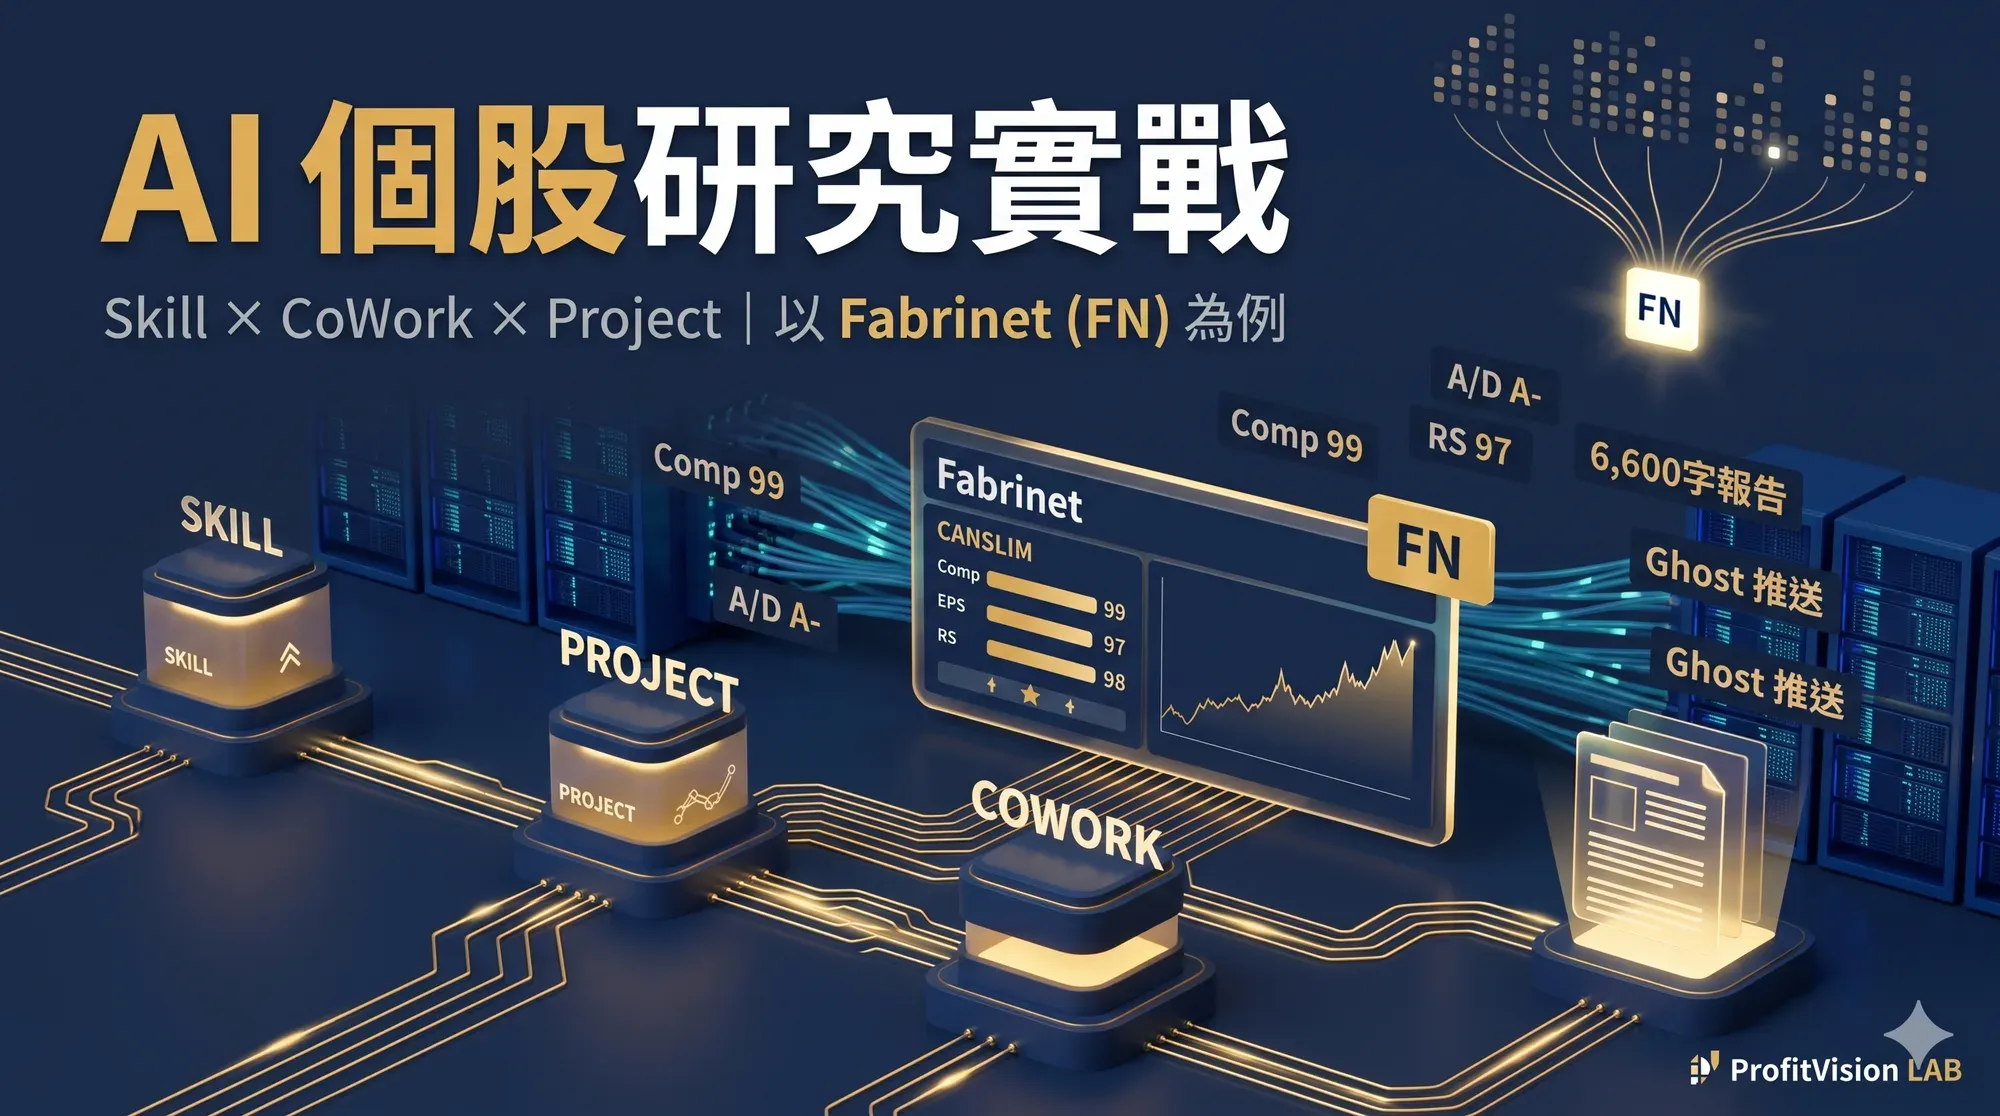
Most people use AI for investment research by 'opening a chat, asking questions, copying and pasting.' This article shows a completely different method: using Claude's three-layer architecture — Skill (standardized screening), Project (a persistent workspace), and CoWork (local execution) — to turn research from a one-off conversation into a repeatable system. Using Fabrinet (FN) as the case study, every step is broken down, from screening FN out of 300 stocks to producing a 6,600-word report and publishing it live.
1. Why "Chatting With AI" Isn't the Same as "Doing Research With AI"
Have you ever had this experience: you spend three hours chatting with Claude, analyze a stock from every angle, and feel like you've made real progress — then the next time you open a new conversation, everything starts from zero. The industry logic you discussed, the financial data you organized, the valuation range you derived — all gone. You have to re-explain who you are, what you're doing, and what your analytical framework is.
This isn't an AI problem — it's a workflow design problem.
The chat interface is a great thinking tool, but it has three fundamental limitations: no memory — every conversation is new, and the previous research doesn't carry forward automatically; no standardization — the quality of your analysis depends on how good your questions happen to be that day, whether you're sharp or tired; no accumulation — the knowledge from ten conversations is scattered across ten windows and never converges.
In early 2026, Claude launched three features that completely changed this: Skill, Project, and CoWork. Each of these three layers solves one problem, and together they form a complete research system. And importantly — this isn't a theoretical framework, it's the workflow I actually use every week. Below, I'll walk through it using the research process for Fabrinet (FN).
2. What the Three Layers of Tools Actually Are: An Office, a Folder, an SOP
Before diving into the real-world example, let me use an analogy to clarify the relationship between the three.
| Tool | What It Solves | Analogy | Role in Investment Research |
|---|---|---|---|
| Skill | Process standardization | An SOP flowchart taped to the wall | CANSLIM screening rules, the Four-Layer Screen, article templates |
| Project | Persistent context | A folder dedicated to one specific case | The FN research workspace: earnings, notes, and all past analysis in one place |
| CoWork | Getting execution done | Your office — AI sits beside you and does the work directly | Reads local files, runs screening scripts, produces Word/Excel/HTML output |
The key insight: these three are nested. CoWork is the office, Project is the folder for a specific case on your desk, and Skill is the SOP taped to the wall. Within CoWork you can open multiple Projects, and within each Project you can attach multiple Skills. Each has value on its own, but chaining all three together is the real force multiplier.
3. Phase 1: Skill-Based Screening — How FN Rose Out of 300 Names
The Problem: Where Do You Even Start With Hundreds of Stocks?
The weekly MarketSurge exports routinely run 300–800 names. Growth 250 has 300, Minervini Trend has 860, Near Pivot has 47. Reviewing each one manually at five minutes apiece, 860 names would take 70 hours.
My approach: package the screening rules into a Skill — write it once, invoke it forever, unaffected by how I happen to be feeling that day.
The Rules Behind the CANSLIM / SEPA Screening Skill
I built a Skill called marketsurge-canslim-sepa-screener, which packages six screening thresholds:
| Criterion | Threshold | Rationale |
|---|---|---|
| Comp Rating | ≥ 90 | Top 10% on IBD's composite score |
| EPS Rating | ≥ 80 | Top 20% on earnings quality |
| RS Rating | ≥ 80 | Top 20% on relative strength |
| A/D Rating | ≥ B+ | Confirms institutional accumulation |
| SMR Rating | ≥ B+ | Combined sales/margin/ROE quality |
| Ind Group Rank | ≤ 50 | The industry must be among the leading groups |
In addition, the Near Pivot and Recent Breakouts lists require a Base Stage of ≤ 2 (rejecting late-stage patterns), and the Ants List requires an institutional-buying Count ≥ 2. These rules are hard-coded into the Skill, so whether I'm sharp on a Monday or exhausted on a Friday, the screening standard stays exactly the same.
In Practice: Done in 30 Seconds
Claude automatically identified the list types, applied the six thresholds, and produced a tiered report — and did a cross-check to find names appearing on multiple lists at once. In the results, FN (Fabrinet) showed up on 4 lists: Technical Strength, Minervini Trend, Growth 250, and William O'Neil — one of the strongest cross-list signals that week.
Passed all six criteria, appeared on 4 lists, added to the deep-research candidate pool.
For comparison, Cloudflare (NET) was screened out in the same batch at the very first gate, because its A/D Rating was only a C. That doesn't mean NET isn't a good company — it means institutional chip flow currently doesn't support entering with an options-selling strategy. The system has no feelings, and that's exactly its value.
The core value of a Skill: it eliminates the friction of "resetting everything each time" and guarantees consistent quality. The same set of screening rules runs through 300 names in just 30 seconds, and it will never loosen the bar just because "this company's story sounds compelling."
4. Phase 2: Building a Research Workspace With Project — Getting Claude to Remember Everything
The Problem: Three Days of Research, Then Day Four Starts From Zero
The deep research on FN took me five days from start to finish. Day one mapped the industry chain, day two broke down the financials, day three did competitive analysis, day four handled valuation, and day five formatted and published it. If I'd used a plain chat, every day I'd have had to re-paste the earnings data and re-explain "I'm using a six-chapter structure" and "the brand color is #2d3f5e" — just these repeated explanations would eat up 20 minutes. This is exactly the problem Project solves.
How I Set Up the FN Project
In the CoWork desktop app, I created a dedicated Project for FN, containing three things:
1. Instructions: The research framework — a six-chapter structure (industry map → competitive landscape → business quality → growth engines and risks → valuation scenarios → tactical conclusion), brand colors #2d3f5e / #EF9F27, the byline "Shiba the Disciplined," and the Ghost CMS Lexical HTML Card publishing format. Claude reads all of this automatically every time the Project is opened.
2. Reference documents: FN's Q2 FY2025 earnings summary (revenue $1.13 billion, +36% YoY), customer-mix analysis, the optical-networking industry's 400G → 800G → 1.6T technology roadmap, and the results from the prior CANSLIM screen.
3. Attached Skills: the CANSLIM screening Skill and the Options Four-Layer Screen Skill, callable at any point during the research process.
Once set up, coming back three days later and opening the Project, Claude immediately knew: you're researching FN, using a six-chapter structure, last left off at competitive analysis, the earnings data is right here, and the brand formatting is right here.
Claude didn't need me to re-explain the company background, the financial data, or the industry logic — because all of it was already in the Project.
The core value of Project: it lets research be "paused and resumed" instead of "started over every time." That sounds basic, but for any research that takes more than a day to finish, it's the dividing line for quality.
5. Phase 3: CoWork Gets Its Hands Dirty — From Industry Map to Going Live
The Problem: AI Gives You a Pile of Text, But What You Want Is a Publishable Product
In chat mode, Claude's output is text sitting inside a dialogue box, and you have to copy it out, format it, and convert it yourself. In CoWork mode, Claude produces files directly on your computer — HTML, Excel, Word — saved into the folder you specify. This difference sounds small, but it actually changes the entire pace of the work.
The Five-Day Research Process
Day One: The Industry Map. FN isn't an easy company to place. It doesn't design chips, doesn't have a consumer brand, and doesn't face end customers directly — it plays the role of "precision contract manufacturer" within the AI data-center optical-networking supply chain. I asked Claude to research FN's position within the industry chain:
Claude organized this into a clear structure: GPU interconnect → optical networking equipment → optical modules → Fabrinet manufacturing. FN doesn't do design — it does extremely high-barrier precision manufacturing. The advantage of this position is "no matter which optical-module maker wins, FN gets the order"; the risk is customer concentration — the top two customers can account for over 50% of revenue.
Day Two: Financial Breakdown. I dropped FN's earnings data into the Project folder and asked Claude to produce a formatted comparison table. CoWork reads local files directly — no manual copy-pasting into a dialogue box.
| Metric | Data | Assessment |
|---|---|---|
| Q2 FY2025 revenue | $1.13 billion (+36% YoY) | Accelerating growth |
| EPS | $3.36 (an all-time high) | Excellent quality |
| ROE | 18–22% | A highly efficient manufacturer |
| Debt | Zero (D/E = 0.00) | Extremely conservative |
| Free cash flow | Stable and positive | Not burning cash |
| 5-year EPS CAGR | ~20% | High-quality growth |
Day Three: Moat and Competitive Analysis. This was the most contentious conversation I had with Claude. I pushed back: "FN is just a contract manufacturer — where's the moat? Isn't contract manufacturing just about who's cheapest?"
Claude's response made me rethink FN's moat entirely. Manufacturing optical-networking modules isn't low-skill assembly work like "putting together a phone case" — it requires sub-micron-level precision alignment. Manufacturing yield on 1.6T optical modules is the core competitive edge, and FN has accumulated over a decade of process experience in this space. The hidden cost of a customer switching suppliers (requalification, yield ramp-up, delivery delays) is far higher than paying 5% more in manufacturing fees. This isn't a cost moat — it's a technical-qualification moat.
This kind of interaction — "you raise a challenge → AI goes and verifies → you push again → a deeper conclusion gets forced out" — is the real source of research quality. If you only ask "is FN good," you get a PR-release-grade answer.
Day Four: Valuation Scenario Modeling. Instead of asking "what is FN worth," I ran three scenarios:
| Scenario | Assumption | P/E Multiple | Implication |
|---|---|---|---|
| Bull | 1.6T ramps earlier than expected, customer diversification breaks through | 35–40x | The market is willing to pay a premium |
| Base | Current 20–25% growth trajectory holds | 25–30x | A reasonable central valuation |
| Bear | Customers cut orders, optical-networking cycle reverses | 15–18x | The lower end of the historical average |
At the time, FN's P/E had already jumped from a historical average of 20x to 42–52x. That told me: the market had already priced in the bull scenario. To enter, I'd need to be confident I believed in a future even better than the bull case.
Day Five: Production and Publishing. CoWork directly produced the complete HTML report (brand template, six-chapter structure) and generated the Ghost publishing script at the same time. Running a single line, node push-fn-research.js, pushed the article into the Ghost backend; after review, I hit Publish. The entire publishing process took five minutes.
6. Common Mistakes and How to Avoid Them: The Pitfalls I Hit
Using AI for investment research isn't risk-free. Here are the pitfalls I actually ran into:
Claude telling you "FN's moat is deep" doesn't mean the moat is actually deep. AI has a "confirmation bias" tendency — ask it where the moat is, and it will work hard to find one and show it to you. The right approach is to ask the opposite question: "What scenario could break FN's moat?" "Under what conditions would customers switch suppliers?" Only after asking both the positive and the negative case do you get the full picture.
Claude compiles data from multiple sources, but it can mix up figures from different fiscal years, or cite an outdated analyst estimate. Every key financial figure needs to be cross-checked against the original filing. My approach: let Claude organize the framework and qualitative analysis, but always verify quantitative data myself against SEC filings or StockAnalysis.com.
At first I set the A/D Rating threshold at C, and too many stocks passed — the screen stopped being a screen. I later tightened it to B+, and 300 names dropped to just 22, and quality improved immediately. The value of a threshold isn't letting more stocks pass — it's giving you confidence that every stock that does pass is worth your time.
Claude might suggest a $500-wide Iron Condor, but if your account is only $12,000, a single position would already exceed 5% — over your risk-control cap. Write your account size and Risk Unit rules explicitly into the Project's Instructions, and Claude will automatically tailor its suggestions to your actual circumstances.
7. The Full Chain: From Screening to Publishing
Stringing the three phases together, the whole workflow looks like this:
Download Excel
CANSLIM Screen
on 4 Lists
Workspace Built
5 Days of Research
One-Click Live
Every link in this chain is repeatable. The next time I research FICO, MCO, or SHW, there's no need to redesign the process — swap in a different Excel export, open a new Project, run the same Skill and template. Research quality no longer depends on how I happen to feel that day — it depends on how the system is designed.
A Real Comparison of Time Cost
| Step | Fully Manual | With the Three-Layer Toolset | Time Saved |
|---|---|---|---|
| Screening 300 names | ~4 hours | 30 seconds | 99% |
| Setting up the research framework | 30 minutes every time | 0 (Project remembers) | 100% |
| Organizing financial data | ~2 hours | ~10 minutes | 92% |
| Formatting the report + publishing | ~3 hours | ~5 minutes | 97% |
| Overall research (including deep analysis) | ~25–30 hours | ~8–10 hours | ~65% |
Note the last row: the overall savings are "only" 65%, not 99%. That's because the real time sink is thinking — challenging conclusions, cross-verifying, forming a view. That part can't and shouldn't be automated.
What AI saves you is "assembly time": gathering data, formatting, repeatedly re-explaining the framework — freeing you to concentrate on "judgment time": is the moat real or not? How much growth does the valuation already reflect? How much risk can my account actually absorb?
The most expensive thing isn't AI's monthly subscription fee — it's the time you spend on "assembly." Saving 10 hours of assembly time a week adds up to 500 hours a year. Whether you spend those 500 hours thinking more deeply, cross-verifying, or simply resting so you can make better judgments — every one of those uses is worth more than manual formatting.
8. Conclusion: A System Matters More Than Inspiration
Most people do AI-assisted investment research the way they cook: starting each time by "opening the fridge to see what's there." Inspiration-driven, inconsistent quality, unable to accumulate.
The three-layer architecture of Skill / Project / CoWork shifts you from "inspiration-driven" to "system-driven":
Skill guarantees consistency in "how it's done." Whether I'm sharp or not that day, the CANSLIM bar is Comp ≥ 90, A/D ≥ B+. FN passed because the numbers were hard enough; NET was screened out because institutions were selling — the system has no feelings.
Project guarantees accumulation in "what is known." Day one's industry map doesn't vanish — it becomes an input into day four's valuation. When next quarter's earnings come out, you open the same Project and every past analysis is right there — you're not starting from zero, you're starting from your last conclusion.
CoWork guarantees execution in "what gets produced." The research conclusion doesn't stay stuck as text in a chat window — it becomes a publishable report, HTML that can be pushed to Ghost, an investment note you can track. From idea to finished product, there's no more room for "I'll clean it up some other day."
If you're also doing stock research, whether with Claude, ChatGPT, or Gemini, the core principle is the same: build the system first, then do the research. Spend a day packaging your screening rules, building your research template, and setting up your workspace — that one day of investment will pay you back on every research project from here on.
The market belongs to those who survive the longest. So does a research system.
© 2026 ProfitVision LAB · Shiba the Disciplined · Think with me, not just trade with me.
The stocks mentioned (FN, NET) are used to illustrate the process and are not recommendations.
Investing involves risk; please evaluate carefully based on your personal financial situation.