The Year of the Active ETF: From Taiwan to US Stocks, Who's Actually Worth the Fee?
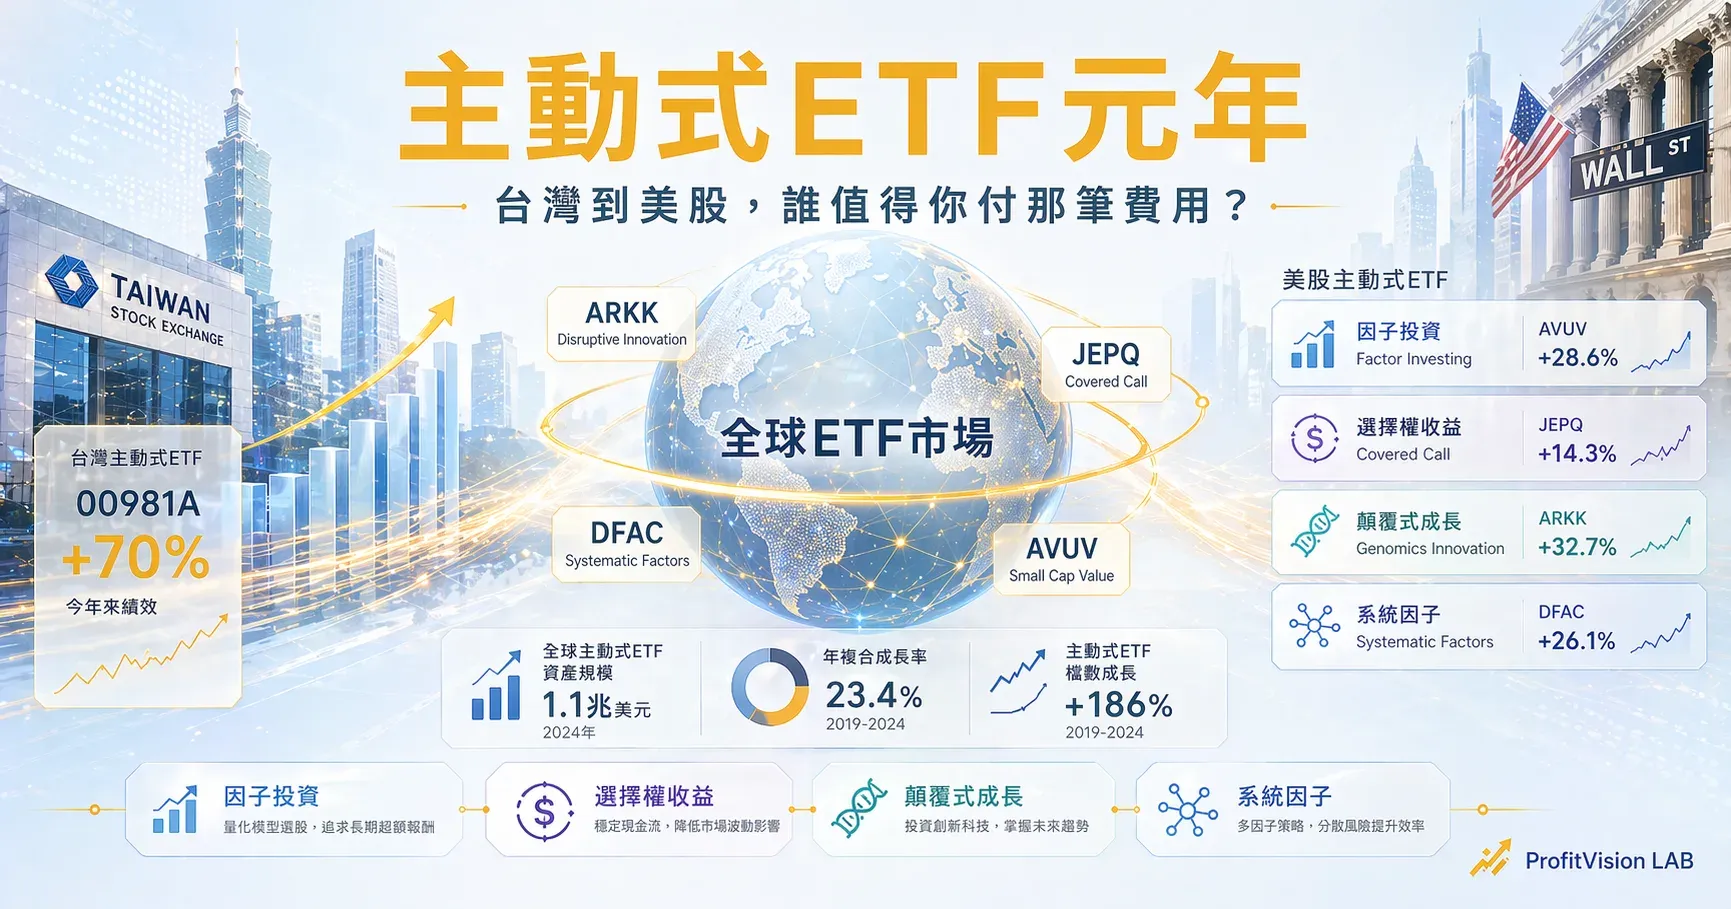
Taiwan's active ETFs delivered a stunning scorecard in 2025's 'Year One,' but a short track record and heavy holdings overlap are the caveats. This piece compares eight flagship US active ETFs — factor-based, options-income, and ARK's disruptive themes — and takes a hard look at whether the ARK family is really worth investing in.
Active vs. Passive: Clearing Up the Concept First
In the market, the three letters "ETF" describe a trading structure, not an investment strategy. Many people assume an ETF is inherently a passive index tracker, but that's simply the version that happened to become popular first, historically.
The real distinction is this:
📊 Passive ETFs
- Track an index, mechanically replicate holdings
- Goal: match the market's return
- Low management fee (0.03%–0.2%)
- Holdings transparent, adjusted per index rules
- Suited to long-term core allocation
- Examples: 0050, SPY, QQQ
🧠 Active ETFs
- Fund manager actively decides holdings
- Goal: beat the index (Alpha)
- Higher management fee (0.5%–1%+)
- Holdings disclosed daily (US requirement)
- Suited to satellite allocation or thematic bets
- Examples: ARKK, JEPQ, AVUV
The core selling point of an active ETF is "someone is actively managing this" — but that's a double-edged sword. Active management creates the possibility of alpha, but it also brings fee drag (Expense Drag) and the risk of human judgment error. Most academic research shows that over the long run, roughly 80% of active funds underperform their benchmark index. That number isn't meant to dismiss all active management — it's a reminder that choosing an active ETF means placing a bet that "this person / this system can beat the market."
Taiwan's ETF market opened as far back as 2003 and has now grown to over NT$6 trillion, ranking among the top three in Asia. But for most of that history, passive ETFs dominated the market — it wasn't until 2025, when the Financial Supervisory Commission allowed active ETFs to list, that the "year one" began. By comparison, the US active ETF market has been developing for two decades, pulling in nearly $475 billion in inflows in 2025 alone — a highly mature and fiercely competitive market.
Taiwan's Year One of Active ETFs: An Impressive Scorecard, With Caveats You Need to Know
In 2025, Taiwan's active ETFs put up genuinely striking performance — three of the top five performers on the board were active ETFs.
Full-year 2025 return
Full-year 2025 return
Full-year 2025 return
By comparison, the "national ETF" 0050 returned 36.87% for the year, ranking only tenth. That gap has prompted many investors to rethink the value of active management.
A Full Roundup of Taiwan's Active ETFs
| Ticker | Name | AUM (NT$100M) | 2025 Return | Strategy Highlight |
|---|---|---|---|---|
| 00981A | Active Uni-President Taiwan Growth | 475 | +70.98% | Heavy concentration in AI electronic components |
| 00980A | Active Nomura Taiwan Select | ~150 | +54.44% | Large-cap blue chips + stock-selection model |
| 00982A | Active Capital Taiwan Leaders | 281 | +44.65% | Fundamentals-based stock picking, mid-stream semiconductors |
| 00990A | Active Yuanta AI New Economy | 100+ | — (newly listed) | AI theme, over NT$10B AUM right at launch |
| 00991A | Active Fuh Hwa Taiwan Future 50 | 100+ | — (newly listed) | Picks the top 50 future-technology names |
Three Caveats You Need to Know
"Active ETFs shine short-term, passive ETFs hold up long-term." — a common conclusion among market observers. This isn't a dismissal of active management — it's a reminder to place it in the right position within your portfolio.
US Active ETFs: Eight Curated Picks From a Mature Market
The US active-ETF ecosystem is far more complex than Taiwan's — systematic factor strategies (Dimensional, Avantis), options-income strategies (JPMorgan, NEOS), and disruptive technology (ARK) each serve different needs. In 2025, US active ETFs overall pulled in close to $475 billion in inflows, with the top six issuers — JP Morgan, Capital Group, Dimensional, iShares, American Century (Avantis), and Fidelity — together capturing roughly 50% of that flow.
The eight names below represent distinct strategic logics. Before picking one, ask yourself: are you after income, factor exposure, or a thematic bet?
Type One: Systematic Factor Investing (Factor-Based)
Factor investing means systematically tilting holdings toward characteristics that academic research has shown to produce long-term excess returns: the size effect, value, and profitability. Dimensional and Avantis are the most credible players in this space, led by former academic economists, with strategies that are repeatable and reasonably priced.
Type Two: Derivative Income
Both are essentially covered-call strategies packaged as ETFs — trading time value for fixed income, sacrificing some upside. JEPQ is a bet on Nasdaq tech volatility: when volatility is high, the option premium is richer. SPYI, through a more refined options structure, retains more upside participation while still generating high income, and most of its distributions are taxed as capital gains, giving it a meaningfully better tax profile than JEPQ. If you're holding in a taxable account, SPYI deserves priority consideration.
Type Three: The ARK Family — Actively Managed Disruptive Themes
ARK runs three funds spanning three themes: ARKK (broad disruptive tech), ARKX (aerospace and defense), and ARKG (genomics/biotech). In these three themes, the market has almost no other genuinely actively-managed ETF competitor — ITA, PPA, and SHLD (defense) and XBI, IBB, and BBH (biotech) are all passive index funds. ARK's scarcity is real; the question is whether scarcity is the same as worth owning.
Morningstar's data for 2014–2023 shows the entire ARK fund family was the single largest wealth destroyer in the US fund industry, costing investors a combined $14.3 billion — ARKK alone destroyed $7.1 billion and ARKG destroyed $4.2 billion. Large numbers of investors bought in at the 2020–2021 peak and exited after the 2022 crash, realizing actual returns far below the fund's reported time-weighted returns. ARK's boom-bust cyclical nature guarantees that most investors enter and exit at the wrong times. This isn't just a Cathie Wood problem — it's a trap created by the very structure of "thematic, high-volatility active ETFs."
ARKK: 10-year annualized return close to SPY, but with double the volatility and a 0.75% fee — on a risk-adjusted basis, not worth a core allocation, at most a speculative position of ≤5% with a firm stop-loss in place.
ARKX: Comparable active peers are almost nonexistent; if you hold a thematic conviction in aerospace and defense, a small position is acceptable. Continuing to outperform SPY into 2026 is a point in its favor.
ARKG: A 12-year annualized return of 3.2% can't be defended by "waiting for the breakout." Unless you have more than a decade of holding patience, passive alternatives like XBI or IBB offer a better edge on fees and diversification.
Type Four: International Small-Cap Value Factor
Comparison Matrix of All Eight Picks: How Should You Choose?
| ETF | Strategy Type | Expense Ratio | Volatility | Suited For | Core Risk |
|---|---|---|---|---|---|
| DFAC | Systematic factor (US) | 0.12% | Medium | Long-term core allocation | Factor premium fails long-term |
| AVUV | US small-cap value factor | 0.25% | Medium-high | Small-cap exposure needs | Small caps lag large caps long-term |
| AVDV | International small-cap value factor | 0.36% | Medium-high | Diversification outside USD + factor premium | USD strength erodes returns |
| JEPQ | Covered call (Nasdaq) | 0.35% | Medium | Tech exposure + monthly income need | Upside capped when tech rallies sharply |
| SPYI | Hybrid options income | 0.68% | Low-medium | Tax efficiency + high yield | Higher fee, more complex strategy |
| ARKK | Broad disruptive active | 0.75% | Extremely high | Very small speculative position (≤5%) | -42% 5-year total return, extreme timing risk |
| ARKX | Aerospace/defense active | 0.75% | High | Investors with an aerospace/defense conviction | No comparable peer, cannot be benchmark-tested |
| ARKG | Genomic revolution active | 0.75% | Extremely high | Only for 10+ year super-long-term conviction holders | 12-year annualized only 3.2%, $4.2B in destroyed wealth |
A Quick Decision Framework
Ask yourself three questions:
Question One: What's your purpose in buying an active ETF?
If it's "long-term wealth accumulation," factor funds (DFAC, AVUV, AVDV) have far more academic support than disruptive-growth bets. If it's "monthly cash flow," income funds (JEPQ, SPYI) fit the need. If it's a "thematic bet," ARKX (aerospace/defense) or ARKG (genomic revolution) each come with their own conviction prerequisites — but read their track records carefully first.
Question Two: How much of a drawdown can you stomach?
ARKK's peak-to-trough drawdown from 2021 to 2022 exceeded 75%, and ARKG's was roughly similar. If that number makes you uneasy, stay away from the entire ARK family. SPYI is designed with a downside-buffering mechanism and outperformed a plain long position during the 2022 bear market, but it still declines along with the market.
Question Three: How much fee are you willing to pay?
Every 0.1% difference in fees compounds into a substantial erosion of terminal value over 30 years. DFAC's 0.12% is nearly free, while the ARK lineup's 0.75% requires generating at least 0.6% of excess return every single year just to offset the fee drag. ARKG's historical annualized return of 3.2% doesn't even clear that bar.
Taiwan Active ETFs vs. US Active ETFs: Structural Differences
| Dimension | Taiwan Active ETFs | US Active ETFs |
|---|---|---|
| Market maturity | 2025 is year one, just getting started | Two decades of history, highly competitive |
| Holdings transparency | Top-10 holdings disclosed monthly | Full holdings disclosed daily (US requirement) |
| Strategy diversity | Currently nearly all Taiwan growth/AI themes | Diverse: factor, income, thematic, fixed income |
| Fee levels | ~0.8%–1.2% (higher than passive) | 0.12%–0.75%, competition keeps fees down |
| Risk concentration | Heavy overlap in AI supply-chain holdings | Wide strategy variation, more diversification choices |
| Short-term performance | Remarkable (within a specific bull-market window) | Some names like ARK have a high-volatility track record |
| Fit for Taiwanese investors | A satellite position expressing a view on Taiwan's AI story | USD-denominated core or thematic long-term positions |
Conclusion: Is an Active ETF Worth It? Ask the Right Question First
The question about active ETFs was never "is someone picking stocks for me" — it's "can this person / this system keep generating returns above the fee, in whatever market environment comes next."
Taiwan's 2025 "year one" of active ETFs was genuinely a meaningful market evolution — it let more investors access something close to actively managed mutual-fund strategies with the transparency and liquidity of an ETF wrapper. But if your current mindset is "this one went up the most, I'll buy it," go back and reread the three caveats in section two.
The eight US names offer a more mature frame of reference: from a nearly-free systematic factor strategy (DFAC), to monthly-paying covered-call strategies (JEPQ/SPYI), to high-conviction tools for disruptive technology (the ARK lineup) — each one answers a specific question.
Think with me, not just trade with me. Before you pick an active ETF, first confirm which problem you're solving — not which ETF went up the most this year.
📋 Tracking Record
| Date | Event | Notes |
|---|---|---|
| 2026/04/24 | Initial publication | Covers a review of Taiwan's Year One of active ETFs + eight flagship US names + a full assessment of the ARK family |