Taiwan Stocks vs VOO vs QQQ: Why Taiwanese Investors Don't Need to Look Far Afield
0050's 15-year total-return CAGR is within 0.1% of VOO's. Once you add in currency conversion costs, U.S. estate tax, and overseas income reporting, Taiwanese investors holding Taiwan stocks may actually come out ahead of U.S. stocks in real terms. Total-return index vs price index: the same Taiwan stock market, 5x vs 13x — a 2.6x gap rooted in the compounding truth behind ex-dividend adjustments.
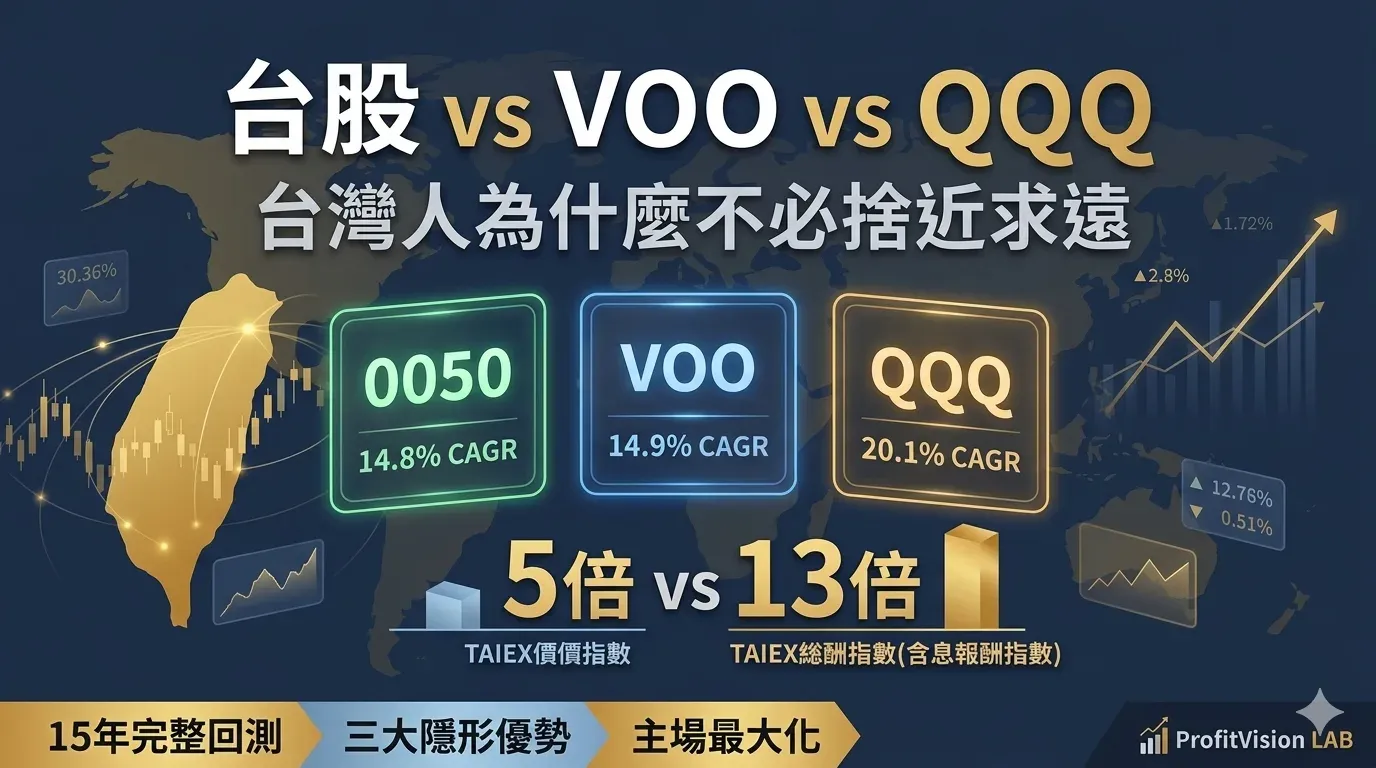
0050's 15-year CAGR is within 0.1% of VOO's. 0052's challenge to QQQ falls short by only 2.5%. But Taiwanese investors hold New Taiwan Dollars — no currency conversion cost, no overseas income reporting, no U.S. estate tax exposure. Let the numbers speak.
Taiwanese investors have long faced a false choice: "Should I buy Taiwanese stocks or U.S. stocks?" The right question is: "What is the actual difference in real return between a Taiwanese investor holding Taiwanese stocks in NTD, and holding U.S. stocks in dollars after currency conversion?" This article answers that question with a full 15-year backtest, and breaks down the three hidden advantages Taiwanese investors have when holding Taiwanese equities: information edge, currency alignment, and lower friction costs. The conclusion: Taiwanese investors don't need to look far afield — home turf is the best starting line.
1. A Number Worth Rethinking
In Taiwan's investing community, there's a saying that's been repeated for years:
"In the long run, U.S. stocks return more than Taiwanese stocks. If you're saving for retirement, buy VOO or QQQ, not 0050."
There's some truth to this, but it overlooks one crucial variable: what currency are you measuring returns in?
Let me give you a number first, then unpack what it means.
15-year annualized (TWD)
2011–2025
15-year annualized (USD)
2011–2025
15-year annualized (USD)
2011–2025
CAGR gap
15-year backtest
You read that correctly. Taiwan's flagship ETF, 0050, has a 15-year total-return annualized return within 0.1 percentage points of VOO (which tracks the S&P 500), the global benchmark.
This number upends most people's intuition that "Taiwanese stocks underperform U.S. stocks." More importantly, once you factor in the hidden costs facing Taiwanese investors, that 0.1% gap may not even exist.
Price return: measures only the change in share price, excluding dividends. TAIEX (Taiwan Capitalization Weighted Stock Index) is a price index — this is exactly why Taiwanese stocks "appear" not to have grown enough over the long run: on ex-dividend dates, the index gets marked down, understating the true return.
Total return: reinvests each year's dividend distributions, giving the true investment return. 0050's total return runs roughly 2–3% higher per year than its price return, and that gap compounds into a very large difference over the long term. All figures in this article use total return.
2. A Full Profile of the Three ETFs
Before diving into the data comparison, let's clarify the positioning and differences of these three funds, to make sure we're comparing apples to apples.
⚠️ Important note: different denominating currencies mean these figures cannot simply be added together.0050 is denominated in TWD, while VOO and QQQ are denominated in USD. This article compares "the return each fund produces in its own currency." The key point: a Taiwanese investor buying 0050 with NTD bears zero currency risk, while investing in VOO/QQQ requires first converting NTD into USD and bearing two-way TWD/USD exchange-rate risk.
3. A Full 15-Year Backtest: 0050 vs VOO
VOO launched in September 2010, so we use 2011 as the backtest start, giving us 15 complete calendar years (2011–2025) of data — the longest comparable period for which both funds have full-year records.
Year-by-Year Return Comparison
| Year | 0050 (TWD, total return) | VOO (USD, total return) | Difference | Winner |
|---|---|---|---|---|
| 2011 | -15.84% | +1.89% | -17.73% | VOO wins |
| 2012 | +11.93% | +16.00% | -4.07% | VOO wins |
| 2013 | +11.67% | +32.39% | -20.72% | VOO wins |
| 2014 | +16.68% | +13.55% | +3.13% | 0050 wins |
| 2015 | -6.31% | +1.31% | -7.62% | VOO wins |
| 2016 | +19.64% | +12.17% | +7.47% | 0050 wins |
| 2017 | +18.13% | +21.77% | -3.64% | VOO wins |
| 2018 | -4.95% | -4.50% | -0.45% | Nearly a tie |
| 2019 | +33.52% | +31.35% | +2.17% | 0050 wins |
| 2020 | +31.08% | +18.29% | +12.79% | 0050 wins big |
| 2021 | +21.97% | +28.78% | -6.81% | VOO wins |
| 2022 | -21.19% | -18.19% | -3.00% | VOO holds up better |
| 2023 | +27.40% | +26.32% | +1.08% | 0050 wins |
| 2024 | +48.67% | +24.98% | +23.69% | 0050 wins big |
| 2025 | +25.74% | +17.82% | +7.92% | 0050 wins |
| 15-year CAGR | 14.8% (TWD) | 14.9% (USD) | -0.1% | Nearly a tie |
Over 15 years, 0050 came out ahead in 8 years, VOO in 7. The annualized-return gap is 0.1 percentage points. This isn't Taiwanese stocks "underperforming" U.S. stocks — this is Taiwanese equities, measured in their home currency, running almost neck-and-neck with the strongest index in the world.
CAGR is a tool that "averages" a multi-year total return into a single annual figure. For example: if an investment grows to 8 times its original value over 15 years, the CAGR is roughly 15.3% — meaning "if it had grown at this steady rate every year, the result after 15 years would match the actual outcome." It's more accurate than a simple average annual return because it accounts for compounding.
What Cumulative Returns Actually Look Like
If you invested NT$1,000,000 in 0050 and the NTD equivalent of NT$1,000,000 (converted to USD) in VOO at the start of 2011:
NT$1M invested start of 2011
→ end of 2025 (TWD)
same NT$1M invested
→ end of 2025 (USD)
only NT$90,000
(before currency conversion costs)
The gap between the two is NT$90,000 — and that's before accounting for any currency conversion cost, overseas income tax, or U.S. estate tax. Once you add in these hidden costs, VOO's real advantage may vanish entirely, or even reverse.
4. Three Hidden Advantages for Taiwanese Investors
"The 0050 vs VOO CAGR gap is only 0.1%" is already a strong signal. But this comparison hasn't yet accounted for the three hidden advantages a Taiwan-based investor holding 0050 enjoys. Once you factor those in, the conclusion that "Taiwanese investors don't need to look elsewhere" becomes even more solid.
Advantage One: Currency Risk — A Long-Underestimated Cost
Taiwanese investors buying U.S. stocks first need to convert NTD into USD. That single action alone creates two costs:
Direct conversion cost: banks or brokers typically charge a 0.3–0.5% bid/ask spread on currency conversion. Doing this once going in and once coming out amounts to roughly 0.6–1.0% round trip. Compounded over 15 years, this friction cost is not negligible.
Currency risk: more importantly, there's the exchange rate's own volatility. If the NTD appreciates against the USD, your dollar-denominated assets shrink when converted back to NTD. In recent years the NTD has broadly trended stronger, which is a systemic headwind for Taiwanese holders of USD assets.
A Taiwanese investor holding 0050 has none of this problem. You earn in NTD and spend in NTD — no currency conversion required at all.
Add up these hidden costs, and VOO's "0.1% CAGR advantage on paper" for a Taiwanese investor may be completely eaten away in practice. The U.S. estate tax in particular is worth flagging — a non-resident alien holding more than $60,000 in U.S. stocks could see their estate taxed at rates up to 40%. This is a rarely discussed but far-reaching tail risk.
The U.S. levies estate tax on U.S.-situs assets held by non-residents (including Taiwanese investors). The 2026 exemption for non-residents is only $60,000 (roughly NT$2 million), with amounts above that taxed at rates up to 40%. In other words, if you hold more than NT$2 million worth of VOO, you theoretically face estate-tax exposure.
Holding a Taiwanese ETF (like 0050) carries none of this risk — Taiwan does not apply an equally aggressive estate tax regime to equity holdings, and Taiwan's estate tax exemption is much higher (NT$13.33 million).
Advantage Two: Information Edge — You Know Before Foreign Investors Do
Peter Lynch famously said, "Invest in what you know." That advice has a very concrete application in Taiwan:
You live every day inside Taiwan's most important industries. TSMC's monthly revenue, the details from MediaTek's earnings calls, the big AI server orders Quanta just landed, the shipment progress on Foxconn's GB200 builds — this is everyday information circulating within Taiwan's tech-industry networks, while foreign analysts need to fly to Taiwan, conduct industry surveys, and translate materials just to access it.
This information advantage isn't a one-off — it's structural, ongoing, and directly translatable into investment decisions.
More importantly: Taiwanese investors face zero language barrier, zero time-zone lag, and zero cultural barrier in using this edge. You can act the moment TSMC releases its monthly revenue figures, without waiting for an English translation.
Advantage Three: Currency Alignment — The Most Underrated Financial Wisdom
A Taiwanese investor's financial structure looks like this: salary received in NTD, mortgage paid in NTD, retirement spending in NTD. That means the "liability side" of a Taiwanese investor's balance sheet is entirely NTD-denominated.
Allocating assets to Taiwanese stocks aligns the asset side and the liability side in the same currency — this is called a "natural hedge," one of the most basic risk-management principles in financial planning.
Contrast this with investing in U.S. stocks: your spending is in NTD, but your assets are in USD. If the NTD appreciates significantly by the time you retire, the dollar assets you worked hard to build up could convert back into far less NTD than expected. This currency risk, spread over a 20–30 year retirement planning horizon, is a systemic exposure that shouldn't be ignored.
"Converting your NTD income into USD to buy VOO adds a risk you don't need to take. Your retirement spending is denominated in NTD, so your core assets should be too." — Shiba the Disciplined
5. 0052 vs QQQ — The Real Competitiveness of Taiwan's Tech ETF
The comparison so far has been "Taiwan broad market vs U.S. broad market." Now let's move to a more interesting layer: if you want concentrated tech exposure, does Taiwan have an equivalent option?
The answer is 0052 — Fubon Technology, which tracks the "Taiwan Information Technology Index," with holdings drawn exclusively from Taiwan's tech leaders: TSMC, MediaTek, Foxconn, ASE, Quanta, Auras, and others.
Putting 0052 and QQQ side by side, using the full 18-year dataset from 2008–2025:
18-year CAGR (TWD)
2008–2025
18-year CAGR (USD)
2008–2025
since inception, total return
TWD-denominated
since inception
TWD total return
The Key Insight: 0052 Crushes QQQ in AI Boom Years
| Year | 0052 (TWD) | QQQ (USD) | Difference | Context |
|---|---|---|---|---|
| 2009 | +84.4% | +54.7% | +29.7% | Post-financial-crisis rebound, 0052 surges |
| 2020 | +57.4% | +48.6% | +8.8% | Pandemic tech surge, Taiwan manufacturing benefits |
| 2023 | +45.4% | +54.9% | -9.5% | AI software/application valuations expand, QQQ wins |
| 2024 | +56.6% | +25.6% | +31.0% | AI hardware demand surges, Taiwan supply chain leads |
| 2025 | +31.4% | +20.8% | +10.6% | AI infrastructure buildout continues |
The pattern is very clear: when AI hardware demand surges (chips, servers, packaging), 0052 crushes QQQ. When AI software/application valuations expand (Microsoft, Meta, Alphabet), QQQ wins.
These two ETFs aren't competitors — they're complements. One represents the AI infrastructure layer, the other the AI application layer. For a Taiwanese investor, holding 0052 means direct exposure to the most critical node of the AI hardware supply chain, without needing a secondary pass-through via U.S. tech stocks.
6. So How Do We Explain QQQ's 20.1% CAGR?
Let's be honest about the numbers: QQQ's 15-year CAGR of 20.1% is indeed 5.3 percentage points higher than 0050's 14.8%. That's not a small gap — compounded over the long term, it represents a substantial difference in wealth.
This gap is real. But there are three pieces of context worth understanding behind it:
Context One: QQQ's Excess Return Mainly Comes from AI Software Valuation Expansion in 2013–2021
QQQ's large lead is, to a significant degree, the result of massive valuation multiple expansion at Apple, Microsoft, Meta, Alphabet, and Amazon during this period. These companies traded at roughly 15–20x earnings in 2013, expanding to 30–50x by 2021. This kind of valuation expansion is a one-time event that is unlikely to repeat to the same degree over the next 15 years.
Context Two: QQQ's Maximum Drawdown Is Deeper Than 0050's
In 2022, QQQ fell -32.6%, while 0050 fell -21.2%. Concentrated tech exposure brings not only higher returns, but deeper drawdowns too. If you bought heavily into QQQ at the start of 2022, the psychological pressure you'd have had to bear was greater than holding 0050.
Context Three: Taiwanese Investors Face Additional Friction Costs Holding QQQ
Strip the currency conversion cost (0.3–0.5% each way), the impact of overseas income tax, and the hidden risk premium of U.S. estate tax out of that 20.1% CAGR, and the actual return that ends up in hand is lower than the headline number. For the average Taiwanese retail investor, these costs are often underestimated.
QQQ's long-term CAGR is indeed 2.5% higher than 0052's.
For investors with high risk tolerance, comfortable in USD, and willing to bear currency conversion and tax friction, QQQ is the stronger choice.
But for the typical Taiwanese investor, the right question isn't "is QQQ better than 0052" — it's "how do I maximize my home-market advantage while capturing a return as close as possible to global tech stocks, at the lowest possible friction cost?"
The answer is: use 0052 as the core, and supplement with QQQ or VOO to fill in AI application-layer exposure — rather than abandoning home turf and converting all your capital abroad.
7. An Allocation Framework for Taiwanese Investors
With the data covered, let's move to what's actionable. Below is an asset allocation framework designed for Taiwan-based investors, built on the core logic: maximize home-market advantage + minimize friction cost + diversify globally to fill the gaps.
| Allocation Layer | Instrument | Suggested Weight | Role |
|---|---|---|---|
| Taiwan core | 0050 (broad market cap-weighted) | 30–40% | NTD-denominated core, home-market advantage, indirect AI hardware exposure |
| Taiwan tech concentration | 0052 (tech-focused) | 10–20% | Direct exposure to the AI hardware supply chain, amplifying Taiwan's core competitiveness |
| U.S. tech supplement | QQQ / VOO | 20–30% | Fills in AI application layer (software, platforms), USD asset diversification |
| Global diversification | VT / AVDV | 10–20% | Hedge against non-tech markets, geopolitical risk diversification |
| Defensive assets | Gold ETF / short-term bonds | 5–10% | Buffer against systemic shocks |
The core message of this framework is: Taiwanese stocks are not your "second-best" fallback choice — they are the starting point and backbone of your asset allocation.U.S. and global assets are the branches, filling in exposure that Taiwanese stocks don't cover — they're not meant to replace Taiwanese stocks.
Whichever allocation ratio you choose, dollar-cost averaging (DCA) is the best execution method for long-term holding. It lets you automatically buy more when the market falls, without needing to time highs and lows, and without regretting a lump-sum purchase made at a peak.
Currently, nearly 1 million accounts hold 0050 through DCA plans, with an estimated NT$10+ billion flowing into Taiwanese stocks each month through DCA. This isn't just a personal investing tool — it's one of the most resilient stabilizing mechanisms in Taiwan's capital markets.
8. One Conclusion
Let me condense this article's core argument into a single paragraph:
Taiwanese stocks (0050) have a 15-year total-return CAGR of 14.8%, versus VOO's 14.9% — a gap of 0.1%. After accounting for currency conversion costs, overseas income reporting, U.S. estate tax risk, and two-way currency exposure, the real return for a Taiwanese investor holding 0050 is very likely to exceed that of holding VOO.
Taiwan's tech ETF (0052) has an 18-year CAGR of 15.3%, versus QQQ's 17.8% — a gap of 2.5%. This gap is partially offset by 0052's outperformance in AI hardware boom years (2009, 2020, 2024), and Taiwanese investors holding 0052 bear no currency risk or overseas tax friction at all.
The conclusion is not "never buy VOO or QQQ." The conclusion is: a Taiwanese investor's asset allocation should start with Taiwanese stocks, not U.S. stocks. Build your core position with Taiwanese stocks, then use U.S. stocks to fill in exposure that Taiwanese stocks don't cover — that is the correct framework for leveraging home-market advantage and maximizing long-term returns.
Taiwanese investors have an edge that foreign capital can never replicate: you live inside this market, you speak the language, you know exactly when TSMC's monthly revenue is released, and your friend works at the Foxconn plant building AI servers.
This home-market advantage isn't sentiment — it's quantifiable alpha.
You don't need to look far afield.
9. The Capitalization-Weighted Total Return Index — The Thirty-Year Truth Behind Taiwan's "Underperformance"
This is where Taiwanese investors are most commonly misled, and it's one of the most important concepts in this entire article. Please read this section carefully.
Have you heard this line before?
"TAIEX at 12,000 is a thirty-year high, which means the Taiwan stock market hasn't grown in thirty years." — A common claim in Taiwanese media, widely repeated, but fundamentally wrong
This claim is wrong because it fundamentally misunderstands how TAIEX (the Taiwan Capitalization Weighted Stock Index) is calculated.
Ex-Dividend and Ex-Rights Adjustments: How the Index Gets "Marked Down" Every Year
Taiwan-listed companies conduct annual ex-rights (stock dividend) and ex-dividend (cash dividend) events. This is a longstanding tradition in Taiwan's stock market, with an average dividend yield of roughly 3–4% — on the high side among major global markets.
The problem lies in how the index is calculated:
When a company pays a cash dividend on its ex-dividend date, its share price automatically drops by the corresponding amount that day (because the company's cash balance has decreased). For example: if TSMC pays a NT$3 per share cash dividend, TSMC's share price will "automatically drop NT$3" on the ex-dividend date.
The TAIEX weighted index calculation fully reflects this price drop — it simply "deducts" that NT$3 and never counts it again.
In other words: you received NT$3 in cash dividends into your pocket, but the index lost the corresponding NT$3 in points. That money "disappears" from the index.
Multiply this effect across every listed company in Taiwan, at an average 3–4% yield per year, compounded over thirty years — the TAIEX weighted index systematically understates Taiwan stocks' true return by roughly 3–4% per year, and the cumulative gap becomes astronomical.
Suppose TSMC's share price is NT$1,000, and today it goes ex-dividend, paying a NT$30 cash dividend.
What happens on the ex-dividend date:
① TSMC's share price automatically adjusts from NT$1,000 to a NT$970 reference price at the open
② The shares you hold show a NT$30 paper loss, but your cash account simultaneously gains NT$30 in dividends
③ For you personally, total asset value is unchanged (shares -30 + cash +30 = 0)
④ But for the TAIEX index: TSMC's price drops from 1,000 to 970, and the index points fall accordingly
⑤ That NT$30 dividend, once taken by you, never "returns" to the index
Conclusion: your actual wealth hasn't decreased, but the index permanently loses the point-value equivalent of that NT$30.Over thirty years, this cumulative "annual markdown" effect makes TAIEX look far more understated than the real return.
One Number to Help You Never Forget This Concept
Now here's a concrete comparison — once you see it, you'll never be fooled again by the line "TAIEX at 12,000 is a thirty-year high":
2003 → 2025
4,800 pts → 23,000 pts
(excludes dividends, understated)
2003 → 2025
with dividends reinvested
(true return)
the same Taiwan stock market
different methodology, 2.6x different result
22 years of compounding
Investing in the same Taiwan stock market from 2003 to 2025:
Look at the TAIEX weighted index (excluding dividends): it rose from 4,800 to 23,000 points, a gain of roughly 5x, equivalent to about 7% annualized.
Look at the TAIEX total return index (dividends reinvested): over the same period it grew more than 13x, equivalent to about 12% annualized.
These aren't two different stock markets — this is the same Taiwan stock market, differing only in whether dividends are counted.
Where does the gap come from? From that 3–4% of dividends deducted every year and never returned to the index.Over 22 years of compounding, that gap balloons to 2.6x.
The Capitalization-Weighted Total Return Index — The Tool That Restores the Truth
The Taiwan Stock Exchange launched the "TAIEX Total Return Index" in 2003 specifically to solve this problem.
This index's calculation assumes that every dividend a company pays is immediately reinvested into the same stock — the "dividend reinvestment" concept. This restores the points that would otherwise be deducted at each ex-dividend event, so the index can accurately reflect the true return of a long-term holder who reinvests every dividend.
Three indices, three different versions of "Taiwan stock returns":
① TAIEX weighted index(the one you see in the news every day): excludes dividends, systematically understates returns, not suitable for evaluating long-term investment performance
② TAIEX total return index(since 2003): includes dividend reinvestment and reflects true returns, but its start date is 2003, with no earlier data available
③ 0050 total return(as shown on platforms like Yahoo Finance): tracks the Taiwan 50 Index, also calculated with dividends included, with an annualized return of roughly 12% since its 2003 inception
Conclusion: next time someone cites the TAIEX weighted index's "low return" to dismiss Taiwanese stocks, you'll know how to respond.
Why Is This Misunderstanding So Widespread?
Because what Taiwanese media reports on every day is the TAIEX weighted index — the one that "drops" at every ex-dividend event, making it look like the Taiwan stock market has been treading water.
The claim "TAIEX at 12,000 is a thirty-year high" compares the 1990 bubble peak (12,682 points) to the index in the 2020s, using the dividend-excluded price index, without accounting for thirty years of accumulated dividend reinvestment. This comparison is mathematically indefensible.
An investor who put NT$1 million into Taiwanese stocks in 1990 and reinvested every dividend would not have "still not gotten back to principal" by 2025 — their assets would have long since surpassed ten million NTD.
Thirty years of Taiwan stock market returns were never the problem. The problem is that most people are looking at the wrong index.
10. Taiwan-U.S. Correlation — Taiwanese Stocks Are Not a Shadow of U.S. Stocks
Another common misconception: "Taiwanese stocks are highly correlated with U.S. stocks anyway, so buying Taiwanese stocks is about the same as buying U.S. stocks — you might as well just buy U.S. stocks directly."
This claim is half right and half wrong.
What the Data Says
Academic research and real market data both show that the correlation between Taiwanese and U.S. stocks differs significantly depending on the time horizon:
| Time Horizon | Taiwan-US Correlation Coefficient | Meaning |
|---|---|---|
| Daily (short-term) | ~0.22 | Low correlation, high short-term independence for Taiwanese stocks |
| Monthly (medium-term) | ~0.74 | Moderate correlation, aligned medium-to-long-term trend direction |
| Taiwan stocks vs Philadelphia Semiconductor Index | Highest | Taiwan stocks track the semiconductor cycle, not the Dow |
| Taiwan stocks vs Dow Jones Industrial | Lowest | Traditional manufacturing has the weakest link to Taiwan stocks |
This data tells us two things:
First, Taiwan and U.S. stocks move in the same medium-to-long-term direction, but they're not a perfect copy of each other.A monthly correlation of 0.74 means that holding both Taiwanese and U.S. stocks still provides real diversification benefit — they're not perfectly synchronized, so a combined portfolio has lower volatility than holding either alone.
Second, Taiwan stocks don't track the "broad U.S. market" — they track the "semiconductor cycle."This explains why Taiwanese stocks have often outperformed the broad U.S. market during AI hardware boom periods (2019–2020, 2024) — because Taiwan sits at the core of the semiconductor supply chain, and the semiconductor cycle directly drives Taiwanese stocks' excess returns.
This characteristic is a structural advantage for Taiwanese investors: working in Taiwan, your natural feel for the semiconductor cycle is inherently stronger than that of the average U.S. equity investor. You know TSMC's monthly revenue trend, and you sense shifts in the tech industry's business cycle earlier. Given the tight linkage between Taiwanese stocks and the Philadelphia Semiconductor Index, this information edge translates directly into sharper investment decisions.
Taiwanese stocks and U.S. stocks are not "the same thing."
Taiwanese stocks are direct exposure to the AI hardware supply chain, while the broad U.S. market is a mixed exposure of the AI application layer plus traditional industries.
Holding both Taiwanese and U.S. stocks gives you genuine diversification — different industry structures, different currencies, different sensitivities to the business cycle.
This is exactly why the right answer isn't "choose Taiwanese or U.S. stocks" — it's "Taiwanese stocks as the home-market core, U.S. stocks as supplementary diversification."
11. Three Real-World Investor Scenarios
The theoretical framework is covered. Now let me ground this article's conclusions in three concrete investor scenarios.
Scenario One: A Newly Graduated Engineer, NT$60,000 Monthly Salary, Wants to Start Investing
This scenario is the most common, and needs the clearest framework.
Common mistake: after hearing a YouTuber say "you should invest in VOO," they open an overseas brokerage account and convert NT$10,000 a month into USD to buy VOO. Then the conversion fees, unfamiliarity with overseas income reporting, and the psychological burden of watching the market across time zones lead them to give up after three months.
A better approach: open an account with a Taiwanese broker, set up a NT$10,000 monthly DCA plan into 0050, automate the deduction, and forget about it. A 0.08% expense ratio, a Chinese-language interface, NTD denomination, and automatic dividend reinvestment (or manually adding to the position with cash dividends). Ten years later, the compounding effect of this habit will far exceed any elaborately engineered U.S. stock allocation strategy.
Once assets exceed NT$5 million, then consider opening an overseas account to diversify into VOO — at that point the currency conversion friction, as a percentage, becomes relatively acceptable.
Scenario Two: A Mid-Career Investor with 10 Years in the TSMC Supply Chain, Deeply Familiar with Industry Cycles
This scenario is where the Taiwanese investor's home-market advantage is most clearly on display.
Someone working at a company connected to TSMC, MediaTek, or ASE has a feel for the semiconductor cycle that no foreign analyst can match. You know when CoWoS capacity is maxed out, how much order visibility AI servers have, and when customers are pulling forward orders versus digesting inventory.
Suitable allocation: 0050 (base layer) + 0052 (tech overweight) + a small QQQ position (AI application-layer supplement), converting your industry knowledge directly into an investing edge. This isn't insider trading — it's applying the industry knowledge you've legitimately accumulated at work to public-market ETF allocation.
Scenario Three: A 55-Year-Old Investor Approaching Retirement, Prioritizing Capital Preservation and Stable Income
In this scenario, Taiwanese stocks' advantage is even more pronounced.
In retirement, your spending is in NTD. Your medical bills are in NTD. Your insurance premiums are in NTD. Your grandchildren's education expenses are in NTD. Putting a large share of your assets into USD-denominated holdings means there's always a currency uncertainty sitting between your spending and your assets.
For a retiree, Taiwan stocks' high dividend yield (average 3–4%) provides a stable stream of income, entirely NTD-denominated, with no currency conversion needed. Taiwan's high-dividend ETFs (0056, 00878, etc.) offer payouts well above bank time deposits, while still preserving some capital appreciation potential.
In this scenario, investing NTD in Taiwanese stocks isn't just "a reasonable" choice — it's "the most natural" choice: your asset side and liability side are unified in the same currency, minimizing the complexity of financial planning and the amount of uncertainty involved.
12. A Test for Yourself
Before wrapping up this article, I want to give you a simple self-test.
There's just one question:
"If you switched your monthly investment from VOO to 0050, would your quality of life decline?"
If the answer is "no" — then you're bearing currency conversion costs, overseas tax risk, language barriers, and time-zone pressure, and giving up the home-market information advantage and Taiwan's excess return during AI hardware booms, all for a 0.1% CAGR gap.
If the answer is "I need more diversification" — then the right approach is "0050 as the primary holding, VOO/QQQ as the supplement," not "all-in on U.S. stocks."
The numbers have already given you the answer. 15 years, a 0.1% CAGR gap.
Home turf is the best starting line.
0050 vs VOO (2011–2025, 15 years)
CAGR: 14.8% (TWD) vs 14.9% (USD) → gap of 0.1%, nearly a tie
After adding hidden costs, the real advantage may favor Taiwanese investors holding 0050
0052 vs QQQ (2008–2025, 18 years)
CAGR: 15.3% (TWD) vs 17.8% (USD) → gap of 2.5%
But in AI hardware boom years (2009, 2020, 2024), 0052 leads by a wide margin
The two are complementary, not competing: 0052 = AI infrastructure layer, QQQ = AI application layer
Core thesis: Taiwanese stocks are the home-market starting point for Taiwanese investors, not a fallback choice.
You now know that Taiwan's stock market returns are already strong enough. But the real story of Taiwan's capital markets is far bigger than this.
On April 16, 2026, Taiwan's stock market capitalization surpassed the United Kingdom's, making it the world's seventh-largest stock market. An island with a GDP just a quarter of the UK's surpassed it in market cap — not through luck, but through thirty years of AI supply chain positioning, and three flywheels now firing at once.
→ Part 3: Taiwan Is Already the World's 7th-Largest Stock Market — And This Is Just the Beginning
© 2026 ProfitVision LAB · Shiba the Disciplined · I teach you how to think, not just what to do
Data sources: Yahoo Finance, Bloomberg, Taiwan Depository & Clearing Corporation, iShares official data, PwC Global IPO Watch.
Annual returns are total returns (dividends included); 0050 is TWD-denominated, VOO/QQQ are USD-denominated.