You Think VOO Is Safe? The Concentration Trap in Passive Indexing, and SPMO's Counter-Logic
The market treats VOO as the safe, diversified choice, but the Magnificent 7 now make up a third of the S&P 500 — what you're buying is already a concentrated bet. SPMO's momentum mechanism offers a form of self-protection that VOO simply cannot provide.
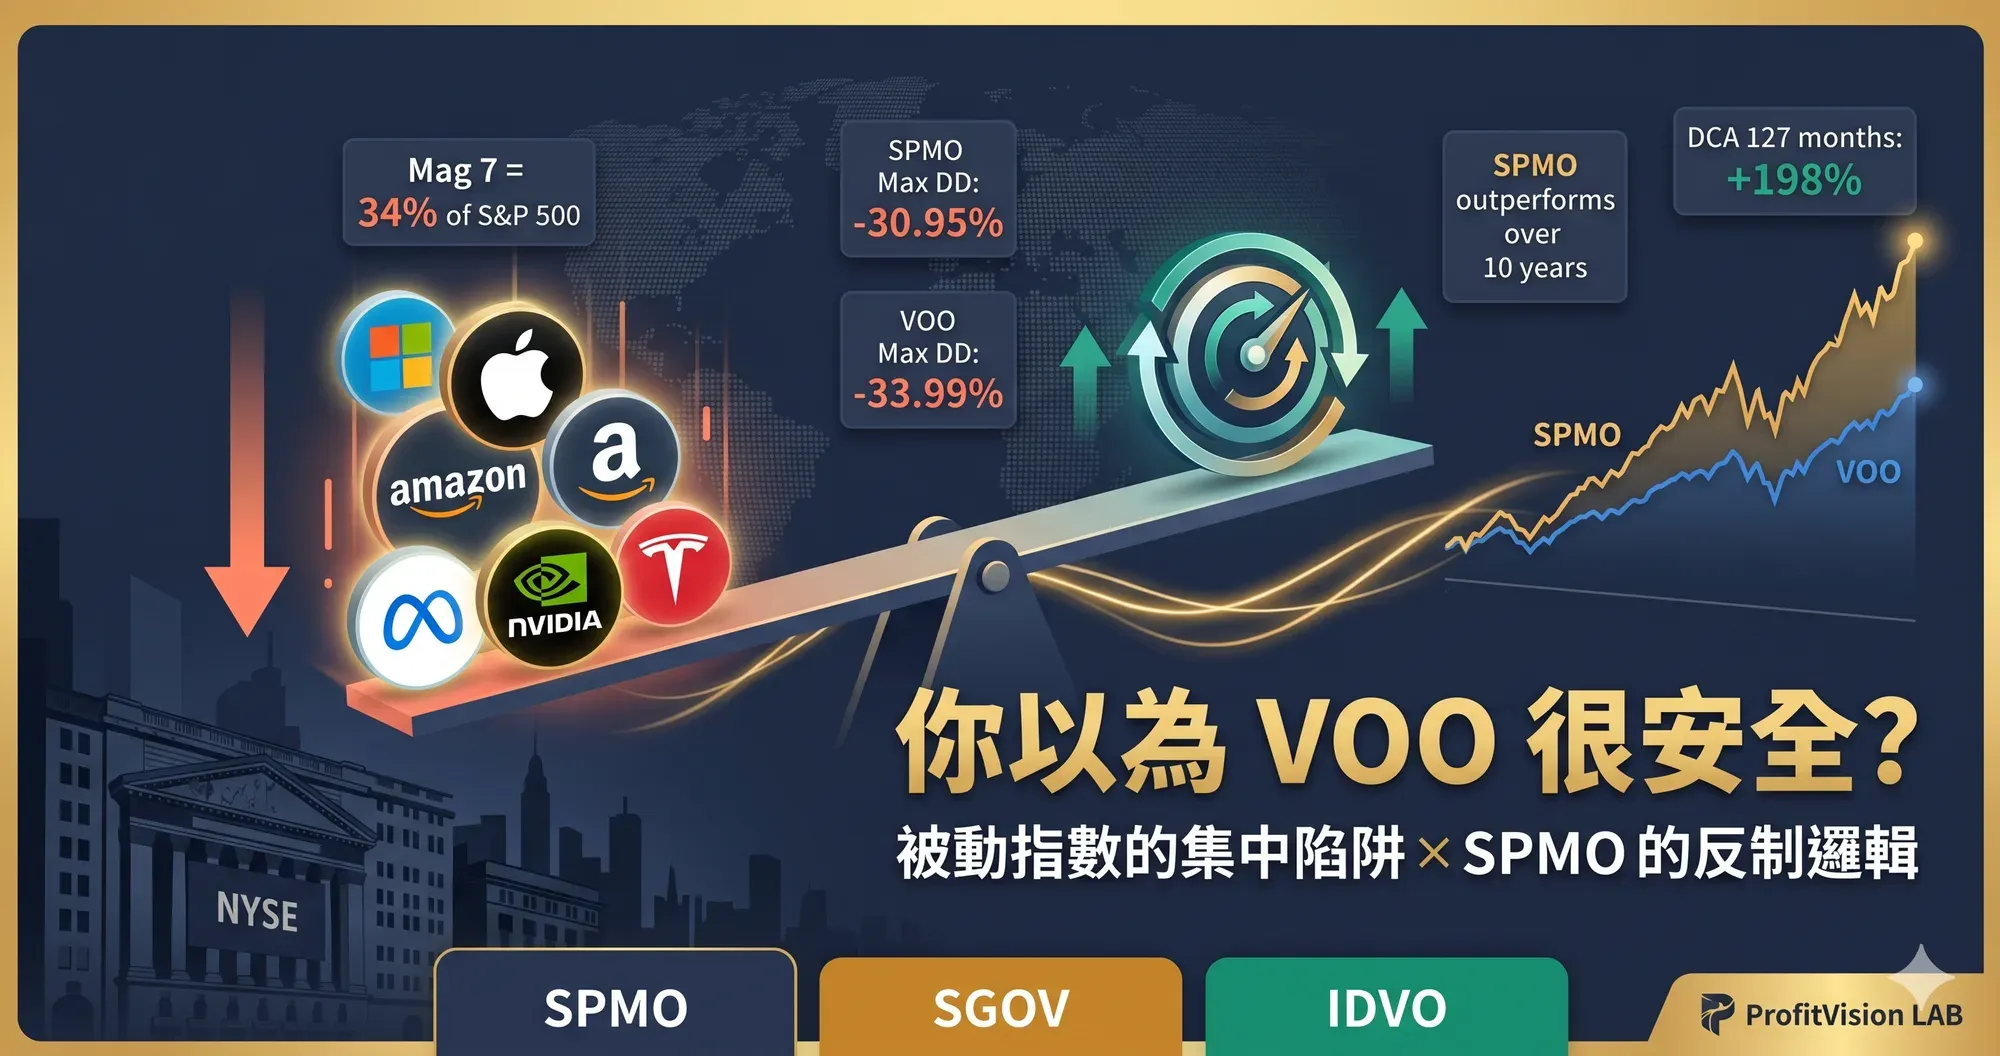
In this market, most people buy VOO because it's "diversified." But when the Magnificent 7 make up a third of the S&P 500, are you really buying diversification — or just another form of concentrated bet?
2026.04.28 | Shiba the Disciplined | ProfitVision LAB
I. VOO's "Sense of Safety" Is an Illusion
When Taiwanese investors talk about US-equity asset allocation, the standard answer is almost fixed: VOO for diversification, QQQ for growth, BND for defense. This combination is called "the gold standard of the lazy-investor strategy."
But it has a problem no one seriously discusses: VOO is becoming less and less diversified.
VOO is a market-cap-weighted index. The bigger a company gets, the higher your allocation to it. Most of the time this mechanism is harmless, even effective — it lets winners naturally grow heavier in your portfolio. But it has a trap with no exit: when the market becomes extremely concentrated in a handful of companies, your "diversified investment" has already quietly become a concentrated bet — and you have no say in the matter.
The numbers are clear: the Magnificent 7 (NVIDIA, Apple, Microsoft, Alphabet, Amazon, Meta, Tesla) went from a 12.3% share of the S&P 500's market cap in 2015 to 34.3% by the end of 2025 — nearly tripling within a decade. The top ten holdings of the S&P 500 now account for 40% of the entire index combined.
In other words, for every $100,000 you put into VOO, $40,000 rides on just 10 companies. Is that really "diversified investing"?
The logic of market-cap weighting is: the more a stock rises, the higher its weight, and the more you are forced to hold. There is no mechanism to trim your exposure when it overheats. When the Mag 7 have tailwinds, VOO soars with them; when headwinds hit, you absorb the entire fall — no buffer, no rotation, just the full brunt of the decline.
QQQ is even more extreme. Within the Nasdaq 100, the combined weight of the Mag 7 is close to 48% — nearly half the index riding on seven companies. You think you're buying technology growth; in reality you're buying seven companies' worth of concentration risk, with 93 supporting-cast tickers attached.
II. SPMO's Logic: Concentration That Is Dynamic, Not Frozen
SPMO (Invesco S&P 500 Momentum ETF) draws from exactly the same universe as VOO — all 500 companies in the S&P 500. The difference is that it doesn't decide who you hold based on market-cap rank, but on a momentum score — 12-month price performance (excluding the most recent month), adjusted for volatility — selecting the 100 highest-scoring names out of the 500.
It recalculates every six months, rotating in new leaders and rotating out names whose momentum is fading.
This mechanism accomplishes something VOO structurally cannot: when a sector overheats, volatility rises, and the momentum score begins to decline, SPMO's scoring system automatically lowers that holding's weight — or removes it entirely — at the next rebalance.
VOO has no such exit. TSMC makes up roughly 30% of Taiwan's TAIEX 50 Index, and NVIDIA's weight in the S&P 500 keeps growing — holders of VOO and Taiwan's 0050 can only watch concentration climb higher and higher, with no mechanism to trim exposure automatically when it overheats.
VOO is "forced to hold the winner until it becomes a loser." SPMO is "holds the winner, but has a mechanism to rotate out of it while it's still a winner." This is a fundamental structural difference, not just a difference in return figures.
III. Verifying the Numbers: Where Does SPMO's Downside Protection Come From?
If SPMO's logic is correct, it should perform better than VOO in headwinds — or at least no worse. Let the historical numbers speak:
| Year | SPMO | VOO | QQQ | Market Conditions |
|---|---|---|---|---|
| 2022 | −10.46% | −18.19% | −32.58% | Rate-hike bear market, tech sell-off |
| 2024 | +45.81% | +24.98% | +26.55% | AI wave, momentum extremely concentrated |
| 2025 | +26.57% | ~+16% | ~+18% | AI infrastructure continues, momentum extends |
| 2023 | +17.55% | +26.32% | +54.85% | V-shaped tech rebound, SPMO lagged |
| 2020 | +28.28% | +18.37% | +48.63% | Post-COVID tech leadership |
| 2018 | −0.90% | −4.52% | −1.04% | Correction year |
2022 was the pivotal year. VOO fell 18%, QQQ fell nearly 33%, and SPMO fell only 10.5%. This wasn't luck — at SPMO's March 2022 semiannual rebalance, the momentum scoring system had already lowered the scores of overheated tech names and rotated into energy and healthcare, both of which actually rose in a rate-hiking environment.
What about VOO and QQQ? They kept holding on to the largest-cap tech stocks and absorbed the full decline. This is the cost of "frozen concentration" versus "living concentration."
SPMO's weakness also deserves an honest accounting: during the 2023 V-shaped rebound, it lagged VOO by nearly 9 percentage points. The reason again comes from the mechanism — after a sharp rebound following the crash, SPMO was still holding its older, more defensive allocation, and had to wait until the next rebalance to rotate back into tech. VOO held everything and captured the entire rebound immediately. This "rotation gap" is SPMO's one genuine weakness — accepting it is the price of using the strategy well.
Comparing Risk Metrics: Smaller Maximum Drawdown, Higher Risk-Adjusted Return
| Risk Metric | SPMO | VOO | Interpretation |
|---|---|---|---|
| Maximum Drawdown (since inception) | −30.95% | −33.99% | SPMO actually smaller |
| Annualized Standard Deviation | 20.0% | 17.1% | SPMO has higher day-to-day volatility, a 2.9% gap |
| Sharpe Ratio | 0.95 | 0.90 | More return per unit of risk |
| Calmar Ratio (return / max drawdown) | 0.60 | 0.44 | SPMO significantly better than VOO |
| Downside Capture Ratio | 82.78% | ~100% | When the market falls 10%, SPMO has historically only fallen 8.3% |
| 10-Year CAGR | 18.63% | 14.85% | A 3.78% annual gap, an enormous compounding difference over 10 years |
IV. SPMO and 00403A: The Same Mindset, Two Markets in Practice
I place SPMO and 00403A side by side not because they're similar, but because they start from the same underlying question: why follow the index blindly?
SPMO selects the best performers within the S&P 500. 00403A selects the best performers among Taiwan's top 200 companies by market cap. One relies on rules, the other on people — but both reject the logic of passive market-cap weighting, and both try to hold today's strongest stocks rather than accepting whatever the index rules hand them.
In Taiwan's market, this question is even more concrete: TSMC has at one point exceeded 30% of the weighted index, and an even higher share of the Taiwan 50 Index. Passively buying 0050 means accepting a one-company arena centered on TSMC — when TSMC has tailwinds, your returns look great; when TSMC has headwinds, all of 0050 goes down with it, with no buffer whatsoever. 00403A's "cull the weak, keep the strong" mechanism at least provides room for human judgment, letting a manager actively adjust weighting when TSMC's momentum fades, rather than being passively locked in.
| Comparison Dimension | SPMO (US) | 00403A (Taiwan) |
|---|---|---|
| Shared Logic | Reject following a market-cap index blindly; continuously screen out the strong and remove the weak | |
| Execution Method | Quantitative rules, no human intervention | Active manager judgment |
| Rebalance Frequency | Semiannual (March, September) | Monitored daily, can rotate anytime |
| Fee | 0.13% | 1.00–1.20% |
| Core Risk | V-shaped rebound gap; Mag 7 flash crash | Manager misjudgment; NT$83.1 billion scale eroding rotation agility |
| Verifiable Track Record | A full 10-year cycle including a bear market | Listed 2026/5/12, no live track record |
The differences between the two also deserve an honest accounting. SPMO relies on rules — public, verifiable, and unaffected by human bias. 00403A relies on people — a manager's past performance is a reference, not a guarantee — and the NT$83.1 billion scale is itself a real constraint: for a large fund, rotating positions is effectively announcing it to the market, and the cost to agility is real.
V. Redefining the Defensive Layer: A Reserve Force and a Risk-Factor Hedge
If you accept SPMO's logic as the core of your US equity holdings, the next question is: how do you build the defensive layer?
The traditional answer is BND (a US aggregate bond ETF) or TLT (a long-term Treasury ETF). But this answer completely failed in 2022.
That year, BND fell more than 13% and TLT fell more than 31%. Stocks were falling, and "defensive" assets were falling too. The reason is simple: duration makes long-dated bonds highly sensitive to interest rates, and their volatility in a rate-hiking environment is not much less than that of stocks. What you bought wasn't defense — it was a different flavor of risk exposure, just in a different direction.
This framework replaces traditional bonds with two more precisely targeted instruments:
SGOV: A Reserve Force, Not a Hedge Asset
The iShares 0–3 Month Treasury Bond ETF holds only US Treasuries maturing within three months. Its duration is close to zero, it carries almost no interest-rate risk, and its volatility approaches zero. During the 2022 rate-hiking cycle, SGOV barely moved, while BND fell 13% over the same period.
Its function isn't "hedging for you" — it's keeping your ammunition combat-ready. When the market is turbulent, SGOV is a cash substitute while you wait for an entry opportunity, and it pays monthly income too (roughly 3.9% annualized), so waiting still earns a return. A reserve force doesn't charge into battle, but it needs to be ready to deploy at any moment.
IDVO: A Risk-Factor Hedge, Not Passive International Diversification
The Amplify CWP International Enhanced Dividend Income ETF actively selects high-quality, high-dividend ADRs from the MSCI ACWI ex USA universe, while writing covered calls against part of its holdings, targeting 3–4% annualized income from dividends and 2–4% from option premium.
Its key figure is a beta of 0.69. When US stocks fall 10%, IDVO has historically fallen only about 6.9%. This is genuine buffering — driven jointly by geographic diversification (non-US), dividend income (cash flow that dampens volatility), and covered calls (collecting premium that lowers the effective cost basis).
Traditional VXUS is a passive tracker of global market cap, mixing emerging markets and Europe together with no quality screening and no active income generation. IDVO is the product of active management — the two are not the same kind of thing.
| Allocation Layer | Instrument | Functional Role | Suggested Weight |
|---|---|---|---|
| Offensive Core | SPMO | S&P 500 momentum selection, long-term excess-return engine | 55–65% |
| Growth Supplement | QQQ / SCHG | Long-term structural tech trend, fills the gap when SPMO isn't holding the name | 10–15% |
| Reserve Force | SGOV | Zero interest-rate risk, monthly income, dry powder awaiting entry | 10–20% |
| Risk-Factor Hedge | IDVO | International diversification + covered calls, beta 0.69, a genuine buffer layer | 10–15% |
VI. Why Does So Few of the Market Think This Way?
The mainstream narrative in index investing is "don't try to time the market, buy the broad index, hold for the long run." This narrative has merit, but it conflates "buying the broad index" with "diversifying risk." With the Mag 7 now making up a third of the index, buying the broad index no longer equals diversification — it means diversifying 67% while concentrating the remaining 33% into seven companies, with no say in the matter.
Most people don't think this way because the passive-index narrative is simply too powerful. The proposition "you cannot beat the market" is correct, but it has been over-extended into "you should only buy the market." SPMO isn't challenging the logic of "don't pick stocks" — its stock-selection mechanism is quantitative, rule-based, and repeatable. What it challenges is the assumption that "market-cap weighting is the only reasonable way to allocate."
The same logic is easier to see in Taiwan's 00403A: no one would think that "passively holding TSMC at 30%" is an ideal diversification strategy. But in US equities, the concentration problem caused by the Mag 7 exists in exactly the same way — it's just packaged inside a narrative of "the S&P 500 is so diversified," which lets people overlook it.
Think with me, not just trade with me. VOO isn't a bad instrument, but the claim that "VOO is safe and diversified" needs to be re-examined in the market of 2026. Accepting its limits is what lets you make more clear-eyed allocation decisions.
VII. Backtest: NT$3,000 a Month, from SPMO's Launch to Today
Enough of the logic — let the numbers speak. The following backtest runs from October 2015 (SPMO's listing month), dollar-cost averaging $100 (roughly NT$3,000) per month, through April 2026 — 127 months in total. The results for SPMO versus VOO:
| Metric | SPMO | VOO |
|---|---|---|
| Total Return | 198.2% | 123.6% |
| Annualized IRR | 19.74% | 14.67% |
| DCA Average Purchase Cost (NAV) | 183.8 | 177.5 |
| Ending NAV (base 100) | 548.2 | 396.9 |
| Ending Value vs. Average Cost Discount | +66.5% | +55.3% |
Year-by-Year Snapshot: How SPMO's Lead Widened
| Year-End | SPMO Value | VOO Value | Cumulative Invested | SPMO's Lead |
|---|---|---|---|---|
| 2015 | $299 | $299 | $300 | −$1 |
| 2016 | $1,561 | $1,599 | $1,500 | −$39 |
| 2017 | $3,339 | $3,263 | $2,700 | +$76 |
| 2018 | $4,504 | $4,291 | $3,900 | +$214 |
| 2019 | $7,009 | $7,006 | $5,100 | +$3 |
| 2020 | $10,340 | $9,591 | $6,300 | +$749 |
| 2021 | $14,002 | $13,696 | $7,500 | +$306 |
| 2022 | $13,679 | $12,301 | $8,700 | +$1,378 ↑ |
| 2023 | $17,373 | $16,877 | $9,900 | +$496 |
| 2024 | $26,766 | $22,425 | $11,100 | +$4,342 |
| 2025 | $35,218 | $27,193 | $12,300 | +$8,025 |
| 2026/04 | $37,874 | $28,394 | $12,700 | +$9,480 |
High Volatility Is the DCA Investor's Friend, Not Their Enemy
There's a phenomenon in the table worth a closer look: during the 2022 bear market, SPMO fell less than VOO (−10.5% vs. −18.2%), and its lead actually widened from +$306 at the start of the year to +$1,378 by year-end.
This is the mathematics of DCA at work. When NAV falls in a bear market, the same $100 buys more units — SPMO's smaller decline, combined with its volatility profile, meant DCA accumulated slightly more shares at every low point. By the time momentum exploded in 2024–2025, those shares accumulated at low prices were valued at a much higher NAV, and the lead jumped from +$496 to +$8,025, eventually reaching +$9,480.
It should be stated honestly that if the full $12,700 had been invested as a lump sum in October 2015, SPMO's return would have been far higher than under DCA — because more capital would have started compounding earlier. DCA's volatility advantage only holds under the premise that you only have the money to invest each month as it comes in. For most salaried earners, that is exactly the reality.
VIII. Who Is This Framework Suited For?
• You're a salaried employee with a fixed amount to invest each month, and dollar-cost averaging is your only realistic option
• You agree with the logic that "buying a market-cap-weighted index means passively absorbing concentration risk"
• You can accept SPMO lagging VOO in certain years (such as 2023) without switching back at the low
• You want a defensive layer that actually defends, rather than falling alongside stocks the way it did in 2022
• Your investment horizon is 5+ years, giving the momentum factor and DCA's compounding effect time to work together
• You prefer rule-driven logic, trusting a "system" more than trusting "a person"
• You need every year's performance to "track the S&P 500" to feel secure
• You want to adjust your allocation the moment you lag the broad market in the short term — this behavior will get you selling at the worst possible time
• Your investment horizon is shorter than 5 years, since SPMO's momentum cycle may not have completed
• You feel uneasy about a portfolio that only rotates twice a year, and need a higher-frequency sense of active management
© 2026 ProfitVision LAB · Shiba the Disciplined · Think with me, not just trade with me.
📌 This article presents an asset-allocation perspective; its core claims represent the author's viewpoint, not the sole correct answer.
Sources: Yahoo Finance, PortfoliosLab, QuantFlowLab, Invesco, Amplify ETFs, and public data. Data as of April 2026.