ServiceNow v2.1: The Pricing-Power Defense — From UBS Downgrade to a $103 Rebound
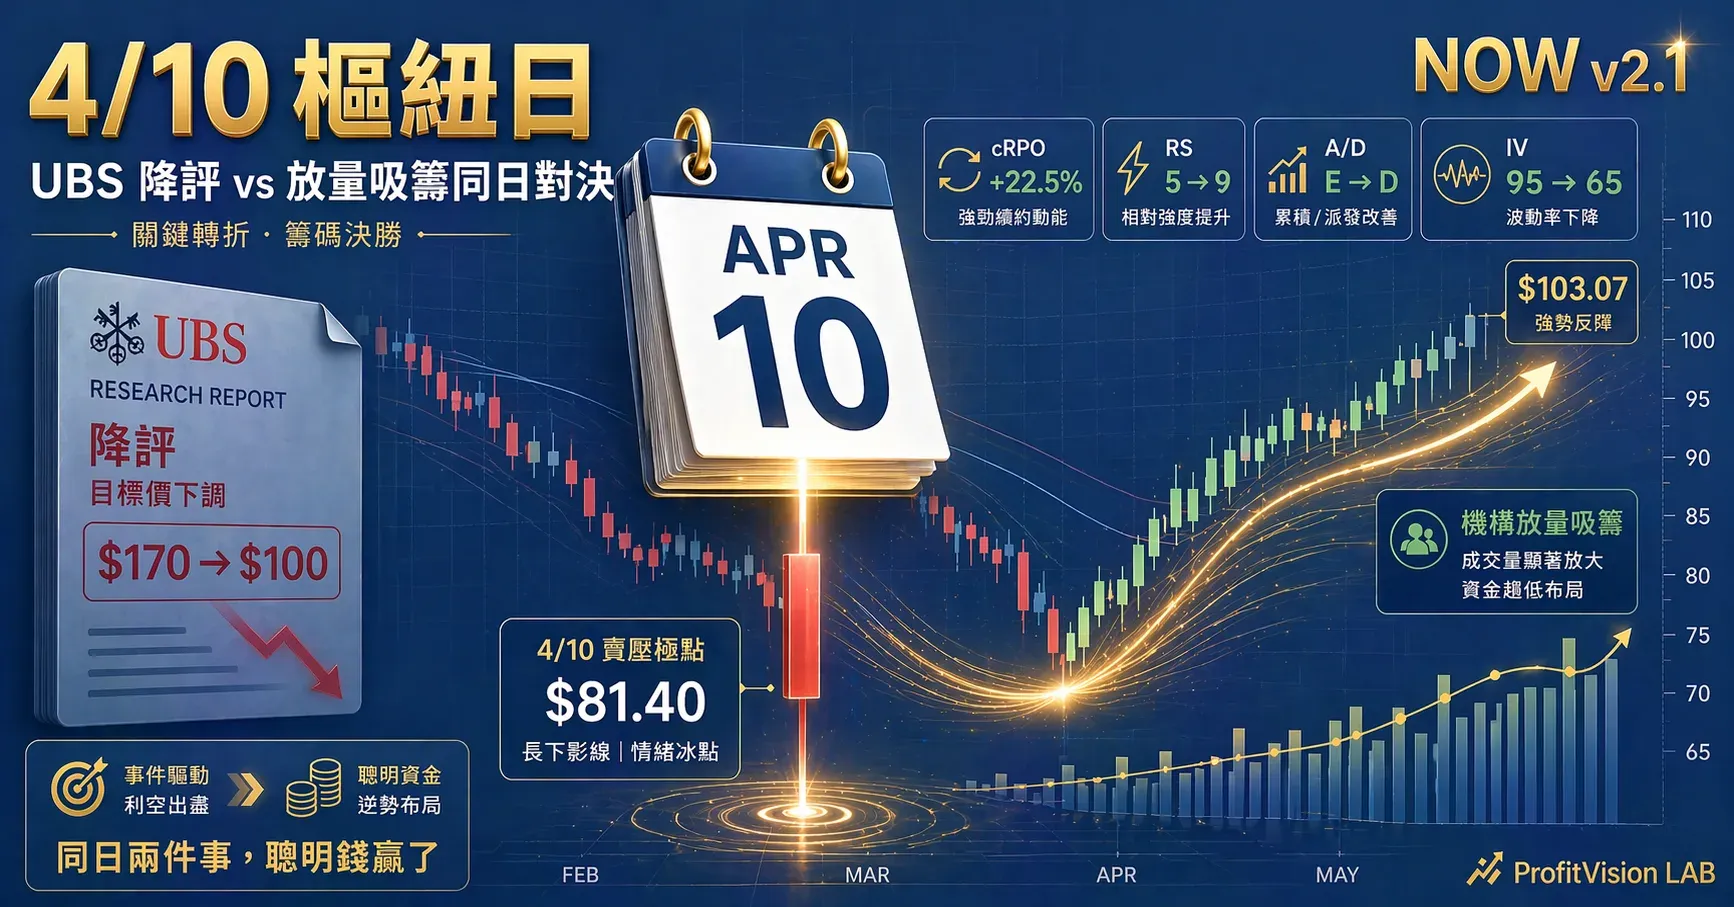
On the day UBS downgraded NOW (Buy→Neutral, price target $170→$100, cRPO estimate 20%→16%), shares surged on 47M volume (2x average) closing with a long lower shadow at $81.40 — traditional data and smart money facing off on the same day. Over the following 8 days, accumulation carried the stock to $103.07, and Q1 FY26 cRPO of +22.5% overturned the UBS downgrade. v2.1 upgrades to a Stage 3 core position-building determination, while reinforcing moat data (97% renewal, 228x for the 2011 cohort, Now Assist $1M+ ACV +130%).
This is v2.1 (updated after Q1 FY26 earnings), superseding v2.0 published on 2026/04/12. The original v2.0 has been annotated at the top pointing to this update. Key updates in v2.1: a Four-Layer Defensive Screen quick-reference table (with real recovery data), a new analysis chapter on the volume surge and accumulation on the day of the 4/10 UBS downgrade, validation of the v2.0 Mythos theses, and the tactical conclusion upgraded from cautious watching to a Stage 3 core position-building determination.
Two Things Happened on 4/10
On April 10, 2026, UBS published a research report downgrading ServiceNow from Buy to Neutral, slashing its price target from $170 to $100, and lowering its cRPO estimate to 16% (from 20%). This was the most complete salvo the bears had fired — coming from one of the most influential names in traditional sell-side research, and the UBS analyst stated plainly that ServiceNow had been the "only Buy-rated stock among application software names" they covered — the downgrade signaled a clear erosion of confidence in ServiceNow's positioning for the AI era.
On that same day, NOW shares bottomed at $81.40, with single-day volume of 47M (roughly 2x the average daily volume), closing with a long lower shadow. In other words, on the very same day UBS dropped its bearish thesis, another pool of capital absorbed all the selling pressure at 2x the average daily volume. This is a textbook technical-analysis pattern — "heavy-volume long lower shadow + selling exhaustion."
Over the following 8 trading days (4/13–4/22), the stock climbed steadily from $81.40 to close at $103.07 on 4/22, a gain of +26.6%, with seven up days against one down day, up-day volume exceeding the average, RS recovering from 5 to 9, A/D improving from E to D, and IV Rank falling from 95 back to 65. Then, after the close on 4/22, ServiceNow released Q1 FY26 earnings: cRPO +22.5%, surpassing Q4 FY25's +21% cc, with full-year subscription revenue guidance raised from $15.53–15.57B to $15.74–15.78B — overturning UBS's downgraded 16% estimate.
This is the pivot point of the story from v2.0 to v2.1. UBS's downgrade wasn't wrong (it reflected the market's fear at that moment) — but it was overruled in real time by smart money. v2.1 sets out to do three things: one, rerun the Four-Layer Defensive Screen using actual results; two, validate the four theses from the v2.0 Mythos chapter; three, examine which stage of the Discipline of Options Three-Stage Framework this signal set corresponds to.
| Filter | Key Metric | v2.0 (4/12) | v2.1 (4/22 actual) | Result |
|---|---|---|---|---|
| Filter 1: Institutional Flows | A/D / RS | E / 5 | D / 9 | 🟡 Recovering |
| Filter 2: Moat | cRPO / AI monetization / large-account expansion / stickiness | 15.49% / 32% / A | cRPO +22.5%, Now Assist $1M+ ACV customers +130% YoY, $5M+ customers at 630 (+22% YoY), average $5M+ ACV of $14.9M, 97% renewal rate | ✅ Reinforced |
| Filter 3: Volatility | IV Rank | 95 (pre-earnings ⚠️) | 65 | ✅ Reasonable range |
| Filter 4: Technicals | Price / volume-price structure | -22% vs 50MA / RSI 26 | $103.07 (-4% below the 50MA at $107), heavy-volume long lower shadow on 4/10, 7 up days vs 1 down day over 8 days | 🟡 Accumulating |
Overall determination: Cautious watching → Stage 3 core position-building determination | The 4/10 heavy-volume long lower shadow confirmed selling exhaustion, an 8-day accumulation structure has formed, and Q1 FY26 earnings validated the fundamentals. Specific execution parameters must be determined by each investor's own portfolio, risk tolerance, and discipline — see the methodology framework in the v2.1 strategy piece.
In This Article
- Chapter 1: The 4/10 Pivot Day — Traditional Data vs. Smart Money on the Same Day
- Chapter 2: v2.0 Trigger Condition Checklist + Q1 FY26 Actuals
- Chapter 3: What the cRPO Beat Really Means
- Chapter 4: How to Read the 8-Day Accumulation Structure — This Isn't a Retail Rebound
- Chapter 5: The Dual Signal of the Early Armis Close and the Middle East 75bps
- Chapter 6: 🔄 Mythos Chapter Thesis Validation Table (v2.0 vs. v2.1)
- Chapter 7: Four-Layer Defensive Screen Detailed Review + Tactical Conclusion
- 📡 Daily Tracking Metrics (Through Q2 FY26 Earnings, to 2026/07)
- Tracking Log
Chapter 1: The 4/10 Pivot Day — Traditional Data vs. Smart Money on the Same Day
This is the one date v2.1 most wants readers to remember: April 10, 2026. What happened that day is the pivot of this entire NOW move.
First Half: UBS's Bearish Downgrade Thesis
On 4/10, UBS published a downgrade report on NOW with three key points:
- Rating cut from Buy to Neutral
- Price target slashed from $170 to $100 (-41%)
- cRPO estimate lowered to 16% (from 20%)
The UBS analyst's exact words in the report are worth reading in full: "Up to now, we have believed ServiceNow is better positioned than other application software companies in the AI era, which is why it has been the only Buy-rated stock we cover among application software names. But that conviction has weakened, and we are hearing more and more cases of budget pressure on non-AI application software. Even though the stock has already de-rated significantly this year to 15x 2026 FCF, we are still moving the rating to Neutral." The significance of this passage is: UBS didn't downgrade because something went wrong at ServiceNow specifically — it was because their confidence wavered on the overall "positioning of application software in the AI era." In other words, the essence of UBS's downgrade is a sector-level concern spilling over onto an individual stock.
This wasn't an ordinary report. UBS is one of the most influential sell-side names in NOW's coverage group, and a downgrade like this often triggers a chain reaction of selling from index funds, quant risk models, and copycat institutions. The stock's price action on the morning of 4/10 confirmed exactly that expectation — a sharp drop at the open, multiple support tests intraday, and volume that surged to 2x the daily average (47M shares).
Second Half: The Other Side of the 2x-Volume Absorption
But the closing candle tells a different story. The stock bottomed at $81.40 and rallied strongly into the close, closing with a long lower shadow. Volume of 47M was 2x the average daily volume, meaning it wasn't just that selling was heavy — buying was equally massive — behind every share sold, someone was absorbing an equal amount.
This combination has a specific term in technical analysis: a selling climax. Its structure consists of concentrated panic selling + heavy turnover + a reversal pattern.
The Key Question: Who Absorbed the Selling on the Day of the UBS Downgrade?
The buyer behind 2x average daily volume can't be retail. To absorb the 47M shares of selling triggered by the UBS downgrade, the buyer must meet three conditions: substantial capital, an independent fundamental view, and the conviction to bet against the UBS thesis. That only leaves three types of capital:
- Fundamentals-driven mutual funds and pension funds: they have their own cRPO tracking models and knew UBS's downgrade to 16% was too pessimistic
- Activist investors: treating the UBS downgrade as a "wrongly punished" research opportunity
- ServiceNow management itself: entering via the ASR (accelerated share repurchase) channel (Q1 buybacks of roughly 20M shares, more than double the full-year 2025 pace)
Whichever it was, they were all betting that UBS's downgraded 16% cRPO estimate was wrong. Q1 FY26's actual cRPO of +22.5% shows that bet was correct and UBS misread the situation. The money that absorbed the panic selling at 2x volume on 4/10 was vindicated 12 trading days later.
Why This Matters So Much for v2.1
In investment research, the most valuable signal isn't "consistent data" — it's "who was right when the data diverged." When UBS's downgrade and smart-money accumulation faced off at the same place on the same day, the market left behind a remarkably clean real-world test case. Q1 FY26's earnings data became the judge — cRPO +22.5% shows the smart-money read was accurate, and UBS's downgraded 16% estimate was overturned.
What this means for us: Filter 1's "A/D = E" was a hard veto in v2.0, but when that E shows up in a setting where "the traditional sell-side thesis is immediately overruled by larger capital," the meaning of that veto must be reassessed. The 4/10 heavy-volume long lower shadow shows this E wasn't a signal of institutions exiting — it was a signal of institutions changing hands.
Chapter 2: v2.0 Trigger Condition Checklist + Q1 FY26 Actuals
In v2.0 we laid out five "reassessment trigger conditions." This earnings report, plus the intraday action over the 8 days beforehand, has now answered all five:
| v2.0 Trigger Condition | Actual Result | Verdict |
|---|---|---|
| Q2 cRPO growth recovering to ≥ 20% | Q1 cRPO reached $12.64B, YoY +22.5%, +21% cc, surpassing Q4 FY25's +21% cc | ✅ Met |
| Now Assist ACV surpassing $1B | Overall AI portfolio moving toward the $1B target; Now Assist $1M+ ACV customers +130% YoY serves as a proxy signal | ⚠️ Partially met |
| A/D Rating recovering above C | A/D recovered from E to D, RS from 5 to 9 — confirms institutional exodus has slowed, but hasn't yet reached the C+ threshold | ⚠️ Right direction |
| Price reclaiming and holding the 50MA | 4/22 close of $103.07 is still 4% below the 50MA ($107), but 7 up days vs. 1 down day over 8 days, with up-day volume exceeding the average | ⚠️ Approaching |
| Price breaking below $75 with expanding volume | The 4/10 low of $81.40 still had an 8.5% buffer above $75; not triggered | ✅ Not triggered |
The most critical message in this table is in the third row: A/D and RS both recovering from the bottom simultaneously, and doing so immediately after bottoming on the exact day of the UBS downgrade. This sequencing matters — a single stock's RS recovery on its own could be noise, but A/D moving up in tandem with RS, in reverse, on "the day of the largest sell-side downgrade," is the classic behavioral signature of "fundamentals-driven institutions betting early that UBS got it wrong."
Chapter 3: What the cRPO Beat Really Means
cRPO (Current Remaining Performance Obligations) is one of the hardest metrics to manipulate in SaaS, and the best predictor of subscription revenue over the next 12 months. It represents revenue obligations already contracted but not yet recognized — the enterprise has already locked in the dollars with a contract, and is simply waiting for monthly recognition.
In the v2.0 era, UBS's cut to its cRPO estimate to 16% (from 20%) was the single most critical bearish point in the entire report — because if cRPO really had fallen to 16%, it would mean subscription momentum over the next 12 months was already breaking down, and no amount of AI narrative could hold back a multiple compression.
The actual Q1 FY26 cRPO figure was $12.64B, up +22.5% YoY (+21% cc) — not only did it not fall to 16%, it surpassed Q4 FY25's 21% cc. This is direct counter-evidence to UBS's 16% estimate, and a falsification signal for the entire bearish thesis that "the SaaS subscription base is being dismantled by AI."
But this needs to be read with a level head: beating on cRPO doesn't mean "AI monetization has already succeeded" — it only means "as of Q1, enterprises are still willing to sign subscription contracts of 12+ months." It answers the question of "whether the SaaS subscription base has been dismantled by AI" — and the answer, for now, is no. But it doesn't answer "whether Hybrid Pricing has taken off" — that remains the key unresolved question.
Another signal worth noting: Q1's $5M+ ACV new-deal count reached 16, up +80% YoY. This isn't breadth expansion — it's depth expansion. Existing large customers are increasing spend, not cutting orders. This aligns with the v2.0 Mythos chapter's "Thesis 3: the Armis/Veza acquisition logic validated."
Preemptively Addressing the Q2 cRPO Guide of Only 19%
Careful readers will ask: given Q1's actual cRPO print of +22.5% was so strong, why is management only guiding Q2 cRPO to 19% (19.5% cc)? At first glance it looks like decelerating momentum, but three layers of technical factors address this concern:
- The Armis contract's termination-for-convenience clause limits cRPO recognition: while Q2 guidance includes an Armis 125bps tailwind, some Armis customer contracts include termination clauses, so not all of that contract value can be counted in cRPO. This is an accounting-technical constraint, not demand deceleration.
- The 75bps Middle East on-premise deferral headwind carries through the full year: management chose to conservatively bake the 75bps headwind already realized in Q1 into the full FY26 guidance assumption, rather than assuming it resolves in Q2–Q4.
- CFO Mastantuono's history of conservative guidance: historically, Q1–Q3 guides have run conservative, with actual results beating each quarter. This is a long-term, verifiable pattern of management behavior.
The real counterargument isn't the Q2 cRPO guide number — it's the full-year subscription revenue guidance being raised from $15.53–15.57B to $15.74–15.78B. If fundamentals were weakening, full-year guidance wouldn't have been raised. Q2's 19% cRPO guide is the stacking of technical dilution and conservative assumptions, not a warning sign of underlying momentum.
Chapter 4: How to Read the 8-Day Accumulation Structure — This Isn't a Retail Rebound
The 4/10 selling climax was only the starting point. What truly confirmed the accumulation structure was the internal data over the following 8 trading days (4/13–4/22) — a move from $81.40 to $103.07, a gain of +26.6%.
| Signal | Retail rebound characteristic | Institutional accumulation characteristic | NOW actual |
|---|---|---|---|
| Up-day to down-day ratio | Alternating up and down (4:4, 5:3) | Clearly more up days than down (7:1, 6:2) | 7:1 ✅ |
| Volume on up days | Rebound on shrinking volume (short covering) | Rally on rising volume (buyers entering) | Up-day volume > average ✅ |
| A/D Rating direction | Holds at E or declines | Clear improvement | E → D ✅ |
| RS Rating direction | Minor fluctuation | Clear improvement | 5 → 9 (up 4 notches) ✅ |
All four metrics matched the institutional accumulation signature. The second row deserves particular emphasis — up-day volume exceeding the average is the most direct signal of "new money entering." Retail rebounds tend to be driven by short covering after a grinding decline on shrinking volume — they look like a rally but lack real volume; institutional accumulation is the opposite — every rally is accompanied by rising volume, showing capital is actively absorbing shares.
The Significance of Timing: Pre-Earnings Accumulation Is a Harder Signal Than a Post-Earnings Rally
The most critical point about this accumulation is that it happened before the earnings release. A post-earnings rally (building a position on already-published data) and pre-earnings accumulation (a bet placed while the outcome is still uncertain) are signals of a completely different order.
There are only two motives for accumulating ahead of earnings: one, this capital has its own independent models for cRPO and Now Assist and doesn't buy into UBS's downgrade to 16%; two, it's tracking ServiceNow management's own behavior — Q1's doubled buyback pace is the strongest leading signal of all. If management itself is accelerating buybacks, fundamentals-driven institutions will trigger a "follow the smart money" response.
Chapter 5: The Dual Signal of the Early Armis Close and the Middle East 75bps
Closing Armis Early: Strategic Acceleration, Not Management Panic
Under the v2.0 thesis, the Armis deal was expected to close in the second half of 2026. The Q1 earnings report disclosed that Armis closed early, on 4/20/2026. The short-term cost is transparent: Q2 operating margin faces approximately 125bps of pressure, with Q2 Adj OM guide cut to 26.5% (550bps below Q1's actual 32%), and FCF margin faces about 200bps of pressure. But from a capital-allocation standpoint, there are only two plausible motives for management to close early: one, Armis integration is going more smoothly than expected; two, demand for Mythos-tier AI governance is more urgent than expected, requiring the security stack to be brought online faster. Either way, this is not a signal of deteriorating operations.
More importantly: the flip side of the 125bps cost headwind is a 125bps revenue tailwind — Armis simultaneously contributes roughly 125bps of tailwind each to Q2 cRPO, Q2 subscription revenue, and FY26 subscription revenue. Management's willingness to close early despite short-term margin pressure suggests confidence in Armis's ARR contribution. This is strategic acceleration, not a hasty move born of financial distress. FY26 full-year Adj OM guidance was maintained at 31.5% (50bps below Q1's actual 32%), implying management expects Q3/Q4 to recover the Q2 margin dip — this is disclosed, predictable, short-term margin pressure with a clear accounting cause, not a sign of deteriorating fundamentals.
The "management is panicking" interpretation is directly refuted by the scale of Q1 buybacks. Total Q1 buybacks were 20.1M shares, roughly $2.225B, of which $2B came from the accelerated share repurchase (ASR) announced at the start of the year, covering 18.5M shares, plus open-market purchases of 1.6M shares for $225M. The CFO stated plainly that the main purpose of the buyback is "managing the impact of dilution" — a neutral statement that shouldn't be over-interpreted as a signal of "management is strongly bullish," but is certainly not a sign of "panic" either. $4.2B remained in the buyback authorization at the end of Q1.
Middle East 75bps: Deferred, Not Gone — With cRPO as the Counter-Evidence
CFO Gina Mastantuono's exact words are worth reading closely: Q1 subscription revenue faced approximately 75bps of headwind from the delayed closing of several large on-premise deals in the Middle East.
Three key phrases: one, on-premise is a legacy deployment, not a cloud subscription; two, deferred means the deal hasn't disappeared, just that closing was pushed back; three, cRPO still growing +22.5% is the real counter-evidence — if the Middle East reflected structural demand erosion, it would show up in cRPO, but cRPO didn't decelerate, meaning orders from other regions more than made up for the Middle East shortfall.
At the same time, the CFO raised full-year guidance while retaining a "conservative stance on the geopolitical environment" as a buffer. The hidden message in this two-layer signal is: the Middle East conflict may continue to cause deal delays in Q2 and Q3, and management has already factored this in. If similar language appears again over the next two quarters, it shouldn't come as a surprise — it's already written into the script.
Chapter 6: 🔄 Mythos Chapter Thesis Validation Table (v2.0 vs. v2.1)
| v2.0 Thesis | Q1 FY26 Validation | Verdict |
|---|---|---|
| Thesis 1: Compressed deployment timelines (3–5 years → 12–18 months) | Now Assist $1M+ ACV customers +130% YoY; the 2011 customer cohort's cumulative ACV has reached 228x its original contract value ($100 → $3,520) — short-term AI product adoption acceleration layered on top of long-term stickiness | ✅ Reinforced |
| Thesis 2: AI Control Tower moving from talking point to must-have | Armis closed early, Veza already completed on 3/2; TTM Net New ACV mix diversifying: Technology Workflows down from 52% to 49%, Creator Workflows up from 17% to 21% — new ACV no longer relies purely on traditional IT workflows | ✅ Reinforced |
| Thesis 3: The Armis/Veza acquisition logic validated | $5M+ ACV customers +22%, new deals +80% YoY — large enterprises deepening security-stack purchases | ✅ Reinforced |
| Thesis 4: Accelerating SaaS multiple repricing | The stock fell from $208 to $81.40, then recovered to $103.07 in 8 days — a bottoming accumulation is confirmed, but whether the overall repricing cycle has ended remains undetermined | ⚠️ Undetermined |
The most important line in this table actually isn't one of the four validations — it's the sentence that needs to be added below: the v2.0 Mythos chapter assumed a worst-case scenario — enterprises delaying purchase decisions out of AI panic. Q1 FY26 proved the opposite — large enterprises are accelerating purchases because of urgency around AI governance, and accelerating on both the security and governance fronts simultaneously. This is the single most important bearish v2.0 thesis to be disproven.
But one key unresolved issue from v2.0 must be honestly flagged: the share of ACV coming from Hybrid Pricing remains undisclosed. In the pricing-power war, this is the hardest metric of all. If it remains undisclosed next quarter, the market will begin to wonder whether management is deliberately avoiding the question.
Chapter 7: Four-Layer Defensive Screen Detailed Review + Tactical Conclusion
Filter 1: Institutional Flows 🟡 Recovering (v2.0: ❌ Hard veto)
In v2.0, A/D=E, RS=5, Group RS=19 formed a clear signal of "institutions accelerating their exit." The v2.1 actuals: A/D has recovered from E to D, RS from 5 to 9. Although it hasn't yet reached the C+ threshold, the direction of recovery is clear, the pace is fast (up 4 notches within 8 trading days), and the starting point was the 4/10 heavy-volume long lower shadow (the same day as the UBS downgrade) — this is a classic characteristic of institutions transitioning from "forced selling" to "reverse accumulation."
Filter 1's determination has been adjusted from v2.0's "hard veto" to v2.1's "recovering," supported by up-day volume exceeding the average and the corroborating evidence of the 4/10 selling climax, which lifts the hard-veto status. But it's marked as "recovering" rather than "cleared," meaning continued tracking is still required — if A/D fails to further reach C+, or RS suddenly falls back, the setup determination will need to be reassessed.
Filter 2: Moat ✅ Reinforced (v2.0: ⚠️ Conditional watch)
In v2.0, ROE=15.49% was slightly below the 17% threshold, while EPS growth of 32% and SMR=A both cleared the bar. v2.1 adds five reinforcing signals: cRPO +22.5% (above Q4), Now Assist $1M+ ACV customers +130% YoY, $5M+ customers at 630 (+22% YoY), average $5M+ ACV growing from $14.2M in Q1-25 to $14.9M in Q1-26 (+5%), and a 97% renewal rate (holding steady in the 97–98% range for five consecutive quarters). The significance of this set of metrics is "depth and stickiness together": large customers aren't just growing in number — per-customer spend is expanding too, while overall renewal rates remain rock-solid.
The longer-term structural evidence is the customer cohort growth curve: ServiceNow's 2011 customer cohort has reached, by Q1-26, an ACV of 228x its original contract value ($100 → $3,520); the 2015 cohort is at 175x, and the 2018 cohort at 115x. This kind of long-tail growth is direct evidence that the SaaS subscription base underneath hasn't been dismantled by AI — if AI truly disrupted NOW's subscription logic, this long-tail curve should have collapsed already. The moat determination is upgraded to "reinforced," with the caveat that ROE remains slightly below 17% — a short-term dilution from acquisitions that should normalize after FY27.
Filter 3: Volatility ✅ Reasonable range (IV Rank 65)
In v2.0, IV Rank was 95, layered on top of earnings risk, making it unsuitable for options positioning. The v2.1 actual is IV Rank=65 — with earnings past, it has fallen back into a reasonable range. IV Rank simply describes what historical percentile current volatility sits at, and does not constitute an entry recommendation.
Filter 4: Technicals 🟡 Accumulating (v2.0: ❌ Not supportive)
The 4/22 close of $103.07 is still 4% below the 50MA (roughly $107) — the moving-average position alone hasn't cleared the bar. But the internal structure is completely different: the 4/10 heavy-volume long lower shadow, plus 7 up days against 1 down day over 8 days, plus up-day volume exceeding the average, plus a +26.6% recovery from $81.40. This is a textbook accumulation structure — volume-price structure leading the moving average's turn to bullish.
The technicals determination is upgraded from v2.0's "not supportive" to v2.1's "accumulating." Combined with the institutional-flows recovery and moat reinforcement, this forms the complete set of conditions for a "Stage 3 core position-building determination."
The 4/10 heavy-volume long lower shadow, the accumulation structure over the following 8 days, and Q1 FY26 earnings validating cRPO +22.5% overturning UBS's downgraded 16% estimate — three layers of signal stacking together. Under the Discipline of Options Three-Stage Framework, the current structure matches the third stage's characteristics — "higher lows, trend reverting."
This is only a setup determination. Whether to act, the scale of any action, how to tranche entries, and where to place stops must all be decided by each investor according to their own portfolio, risk tolerance, and risk-management discipline. This article does not constitute any entry or exit recommendation. See the v2.1 strategy piece for the full methodology framework.
📡 Daily Tracking Metrics (Through Q2 FY26 Earnings, to 2026/07)
During the observation window ahead of Q2 FY26 earnings (2026/04–2026/07), the following four metrics are recommended for daily tracking — a significant change in any of them means the setup may be shifting. These are observation signals, not trading instructions — how readers adjust their own positions in response is a matter of individual judgment.
| Metric | 4/22 Close Baseline | 🟢 Setup reinforced | 🟡 Setup weakened | 🔴 Setup reversed |
|---|---|---|---|---|
| RS Rating | 9 | ≥ 80 | Falls back to ≤ 6 | Falls to ≤ 5 |
| A/D Rating | D | Reaches C+ or higher | Drops back to E (single day) | Stays at E for 5 consecutive days |
| Price vs. 50MA | $103.07 vs. ~$107 | Reclaims the 50MA | Breaks recent support | Breaks below the 4/10 low of $81.40 |
| Up-day volume | Up days > average | > average for three consecutive days | Up-day volume shrinks below average | Down-day volume keeps expanding |
The logic for using this table is: all four metrics green = setup reinforced; any single yellow = setup weakened; any single red = setup reversed. Two minutes each day after the close to record these four numbers is all it takes.
Tracking Log
| Date | Event | Setup Determination |
|---|---|---|
| 2026/04/07 | Anthropic releases the Claude Mythos Preview | ⏸️ Cautious watching |
| 2026/04/10 | Pivot day: UBS downgrades Buy→Neutral, price target $170→$100, cRPO estimate lowered to 16% (from 20%); same day NOW bottoms at $81.40 on 47M volume (2x average), closing with a long lower shadow | Selling climax forms |
| 2026/04/12 | v2.0 flagship research published (Mythos update) | ⏸️ Cautious watching |
| 2026/04/13–04/22 | 8-day accumulation: $81.40 → $103.07, 7 up days vs. 1 down day, up-day volume > average, RS 5→9, A/D E→D, IV 95→65 | Institutional accumulation structure forms |
| 2026/04/20 | Armis acquisition closes early (originally expected in H2) | Strategic acceleration signal |
| 2026/04/22 | Q1 FY26 earnings: cRPO +22.5% surpassing Q4, Now Assist $1M+ ACV +130%, full-year subscription guidance raised to $15.74–15.78B, Q1 buybacks of 20.1M shares for roughly $2.225B | cRPO beat as tailwind, UBS's 16% estimate overturned |
| 2026/04/22 after hours | Market reaction to the Q2 cRPO guide of 19% and Q2 Adj OM guide of 26.5% skewed negative (extended trading declined after hours), pending validation in the regular session on 4/23 | Observation window begins |
| 2026/04/23 | v2.1 flagship research published, Four-Layer Defensive Screen rerun | 🟢 Stage 3 core position-building determination |
▸ Next scheduled update: ahead of Q2 FY2026 earnings · late July 2026 ▸ Methodology framework: see the v2.1 strategy piece
⚠️ Disclaimer
This article is for educational and research purposes only and does not constitute investment advice. ProfitVision LAB is not a legally registered investment advisor in Taiwan. All content is based on personal research and analysis of publicly available information, with no guarantee of accuracy or completeness. Investing involves risk; please evaluate independently and bear the corresponding responsibility. Stock prices, indicators, and technical signals referenced in this article describe market facts that have already occurred, and do not represent predictions of future price movement, nor do they constitute instructions to enter, exit, or take any other action.
ProfitVision LAB · Shiba the Disciplined | I teach you how to think, not just what to do