Alphabet (GOOGL) Q3 2026: AI Strength Is Turning into Revenue, but Shareholders Must Fund More Capital First
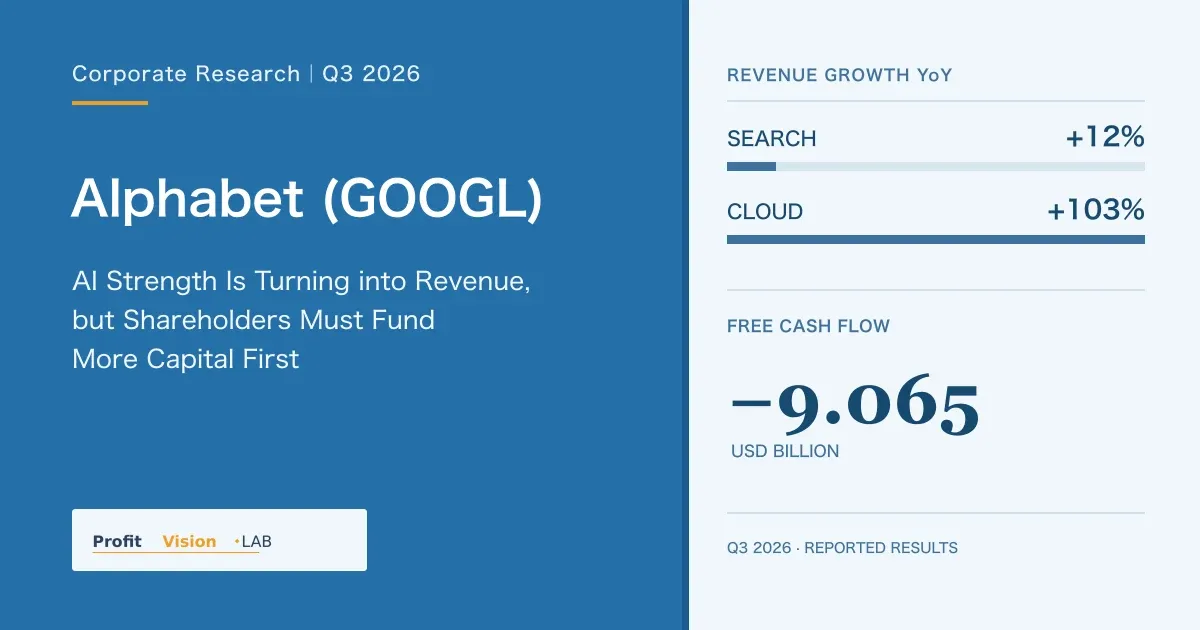
In Q3 2026, Alphabet's search revenue rose 12% and Google Cloud revenue rose 103% to US$30.709 billion, showing AI demand has reached revenue. But free cash flow was negative for a second straight quarter (negative US$9.065 billion in Q3), there were no buybacks in the first three quarters, and funding came from stock and bonds. This report examines six-year depreciation, the support from older-generation TPU still rented on Google Cloud, and the market's reassessment in the three weeks after earnings. Assessment: positive on competitiveness, cautiously neutral on common-stock returns.
📌 Key Takeaways
- Q3 search revenue rose 12% year over year, Google Cloud revenue rose 103% to US$30.709 billion, and group operating income increased by roughly 30%; AI demand has entered Cloud revenue, but the company did not break out standalone profits for AI and TPU.
- Free cash flow was negative US$5.855 billion in Q2 and negative US$9.065 billion in Q3, marking two consecutive negative quarters; there were no buybacks in the first three quarters, with funding instead raised through common stock, preferred stock, and bonds, followed by a €6 billion corporate bond issuance completed on November 5.
- Servers are depreciated over six years using the straight-line method, and depreciation rose 45% year over year in the first three quarters; older-generation TPU remain available for rental on Google Cloud, giving the six-year useful life more support than at NeoCloud, but utilization and revenue by generation were not disclosed.
- The share price fell 12.6% on the first trading day after earnings, while most brokerages maintained positive ratings but collectively lowered their price targets; at approximately US$296, the trailing twelve-month FCF yield was only about 0.55%, leaving insufficient room for capital recovery.
- Assessment: Positive on corporate competitiveness and cautiously neutral on common-stock returns. The next earnings report should be assessed for inventory and collections after TPU deliveries, Cloud profit after third-party capacity increases, and whether 2027 investment guidance includes evidence of returns.
The most noteworthy aspect of Alphabet's quarter is that two things are true at the same time. Search revenue still grew 12%, Google Cloud revenue grew 103%, and group operating income increased by roughly 30%; yet quarterly free cash flow was negative US$9.065 billion, the company halted share buybacks in the first three quarters, and it obtained more funding from common-stock, preferred-stock, and bond investors. Its position in the AI race has strengthened, while the investment burden borne by shareholders has also increased. Q3 earnings release, Q3 10-Q
Assessment: Maintain a positive view of Alphabet's industry position and shift to a cautiously neutral view of stock returns. This quarter has demonstrated that AI-related demand is entering Cloud revenue and that the segment's overall operating income has also increased substantially; however, the company has not broken out standalone profits for AI and TPU, so it cannot yet be established that the related returns are sufficient to pay for expansion, inventory buildup, energy commitments, and common-stock dilution. Investing in Alphabet now means buying a complete AI system that requires continued capital investment. The standard for evaluating it must also shift from revenue growth to recoverable cash per share.
From "Google is not an AI casualty" to the test of capital allocation
The core assessment of Google in the earlier Four Lies About the AI War was that the market saw only the threat to the search gateway and overlooked the combined value of TPU, models, cloud, and distribution. That article regarded Cloud and TPU as sources of a hedge against a long-term decline in search; The AI Compute Race Enters the ROI Verification Phase cautioned that new equipment must pass the tests of depreciation and cash recovery.
By Q3, these two arguments began to converge. Search has not yet declined year over year, and Cloud has already surpassed its earlier quarterly scale of US$15 billion, reaching US$30.709 billion. Therefore, continuing to describe cloud only as "offsetting a decline in search" is no longer sufficiently accurate. Alphabet is expanding advertising, computing services, and TPU system sales at the same time, but the three revenue streams differ in how they tie up capital, recognize profits, and recover cash.
The original research's assessment of the direction of integration capabilities has gained support; the inference that "integration capabilities will therefore benefit shareholders" still requires verification. This report does not carry forward the original separate valuations of TPU and DeepMind, nor does it directly translate lower model unit prices into higher group profit margins. After costs fall, whether the savings go to shareholders, are passed on to customers, or fund more workloads depends on the company's actual choices.
AI is changing the search interface, and Google must still demonstrate results to advertisers
The economic value of search comes from connecting user intent with merchants' opportunities to make transactions. More complete AI answers and longer queries will change where ads appear, click behavior, and the cost of serving each query. Google's advantages are existing user habits, distribution channels, advertiser relationships, and ad measurement systems, which allow it to retain monetization channels while changing the interface; the risk is that users who receive more complete answers may not engage in commercial interactions at the same rate.
Q3 evidence supports the conclusion that demand remains. Search & other revenue rose from US$56.567 billion to US$63.35 billion, and management said search queries grew at the fastest year-over-year rate in five years, with retail and finance major sources of revenue growth. The company also disclosed that AI Mode queries are longer than traditional search queries and that usage is more varied. These figures show that Google can still attract users and advertising budgets, but the company did not separately provide AI Mode revenue, cost per query, or profit margin, so it is not possible to declare directly that AI search unit economics are already superior to those of traditional search. Official earnings call
The strongest evidence for the opposing view is the rate of growth. Search revenue grew about 17% year over year in Q2 and about 12% in Q3; queries increased, but revenue growth slowed. This warrants further investigation, but it is still insufficient to prove that AI is eroding monetization. The CFO cited the comparison base created by accelerated growth in the second half of last year and the impact of exchange rates, and expects these factors to remain a headwind in Q4. Distinguishing between a base effect and a weakening business model requires continued monitoring of revenue, traffic acquisition costs, Services margins, and management's explanations of advertising effectiveness.
Assessment: Search's moat remains intact. The earlier strong conclusion that "Google has already been replaced by AI" is inconsistent with this quarter's financial results; likewise, it is too early to conclude that "queries are at a record high, so there is no problem with the economics." What matters more to shareholders is whether Google can continue to retain sufficient incremental profit after serving more AI queries, rather than merely increasing the number of interactions. Regulatory restrictions on distribution arrangements and the use of search data must also be assessed as part of this revenue chain; fines cannot be treated solely as one-time non-operating noise.
Cloud Doubles, and a Different Business Begins to Emerge Within It
In traditional cloud services, providers first build the infrastructure, then charge businesses based on usage or subscriptions. Google now also sells TPU systems for installation in customers' data centers, extending from chip design to the delivery of hardware, software, networking, and systems. This enables it to serve customers unwilling to place all their computing workloads in Google's own cloud and adds another path to AI budgets.
The two models have very different implications for capital recovery. Infrastructure for the company's own cloud remains on Alphabet's balance sheet, with long-term exposure to utilization, depreciation, energy, and replacement costs; TPU systems sold to external customers tie up cash in inventory and the supply chain before delivery, generate revenue when recognition conditions are met, and ultimately require the company to wait for customer payment. This model may transfer some subsequent responsibility for holding the equipment to customers, but signing an order does not eliminate the need for cash.
Cloud revenue for the quarter was US$30.709 billion, operating income was US$11.121 billion, and segment operating margin was 36.2%. The company said TPU system sales already made a significant contribution to growth and that cloud growth remained strong excluding those sales; however, it did not disclose separate revenue, gross profit, or operating income for the two components. As a result, the 103% growth rate cannot all be treated as repeatable growth in cloud usage, nor can it be directly compared with the different revenue scopes of Azure or AWS.
Management's explanation of the cash cycle was clear. After a TPU system sales contract is signed, the amount first enters backlog, then inventory is built and cash flows out; cash returns only after delivery, invoicing, and collection. The company expects system sales to continue expanding in Q4 and revenue to increase more substantially in 2027. This is a revenue opportunity, but it also entails a period of inventory buildup that must be funded. Official earnings call, TPU system Q&A
Assessment: Selling TPU systems to external customers is an expansion with a sound commercial rationale. It broadens the use of Google's proprietary technology and gives customers an alternative to purchasing from a single cloud provider. But it also changes Cloud's revenue quality and cash cycle. While separate profitability data remains unavailable, it should be assessed as a "new business generating revenue," rather than another Nvidia proven to deliver high returns.
Three Years of Financial Statements Show Cash Growth Has Fallen Behind Investment
Amounts are in billions of US dollars. Free cash flow is calculated as operating cash flow less cash purchases of property and equipment, without deducting acquisitions or finance lease principal.
Metric | 2023 | 2024 | 2025 |
|---|---|---|---|
Group revenue | 307.394 | 350.018 | 402.836 |
Search & other revenue | 175.033 | 198.084 | 224.532 |
Google Cloud revenue | 33.088 | 43.229 | 58.705 |
Group operating income | 84.293 | 112.390 | 129.039 |
Operating margin, calculated by this report | 27.4% | 32.1% | 32.0% |
Operating cash flow | 101.746 | 125.299 | 164.713 |
Cash purchases of equipment | 32.251 | 52.535 | 91.447 |
Free cash flow, calculated by this report | 69.495 | 72.764 | 73.266 |
Cash spending on equipment / operating cash flow | 31.7% | 41.9% | 55.5% |
Data from the three-year income, revenue disaggregation, and cash flow statements in the 2025 10-K. Margins and ratios were recalculated for this report.
Viewed together, the three years make the original issue easier to understand. From 2023 to 2025, operating cash flow increased by approximately US$63 billion, while equipment spending increased by approximately US$59.2 billion and free cash flow rose by only approximately US$3.8 billion. The company's core business did become stronger, but most of the additional cash has been invested in the next round of capacity.
This does not mean "investment increased, so it must be bad." If new equipment can consistently generate revenue above the cost of capital, spending first and recovering the investment later is reasonable. What has changed are the conditions investors must bear. In the past, they could rely on relatively stable advertising cash flow, continuing buybacks, and lower equipment needs; now they must assess whether cloud demand, hardware delivery, and asset replacement can return the cash invested to shareholders. Revenue and operating income growth alone are no longer enough to answer that question.
Operating cash flow in 2025 was also affected by U.S. tax law allowing immediate expensing of some research and development and accelerated tax depreciation for eligible assets that year. This does not mean accelerated depreciation was used in the financial statements, nor should the entire cash improvement that year be treated as purely an improvement in operating efficiency.
Q3 operating profit increased, but Cloud's 36.2% is not the whole picture
Amounts in the table are in billions of US dollars, except EPS, which is in US dollars.
Metric | 2025 Q3 | 2026 Q3 | Comparison |
|---|---|---|---|
Group revenue | 102.346 | 127.577 | Up 24.7% |
Search & other | 56.567 | 63.350 | Up 12.0% |
Google Cloud | 15.157 | 30.709 | Up 102.6% |
Services operating profit | 33.527 | 39.157 | Up 5.630 |
Cloud operating profit | 3.594 | 11.121 | Up 7.527 |
Alphabet-level operating loss | (4.467) | (7.655) | Loss increased by 3.188 |
Group operating profit | 31.228 | 40.576 | Up 29.9% |
Net income available to common shareholders | 34.979 | 26.170 | Down 25.2% |
Diluted EPS | 2.87 | 2.12 | Affected by items including gains and losses on securities |
Source: Q3 earnings release and financial schedules.
Combined Services and Cloud operating profit increased by US$13.157 billion, but the Alphabet-level loss increased by US$3.188 billion and the Other Bets loss increased by approximately US$621 million, leaving group operating profit up US$9.348 billion. This bridge shows that Cloud's growth is real, as are the costs of developing models shared by Cloud and other products.
Alphabet-level expenses primarily include shared AI research and development, which is not fully allocated to Cloud. Treating 36.2% as the complete margin after the full set of AI investments would overstate the return currently supported by the evidence; deducting all shared research and development from Cloud would overlook the benefits to Search, YouTube, and other products. The more reliable conclusion is that the segment figures demonstrate improved operating leverage at Cloud, while group-level returns on capital still need to be verified separately.
Moreover, this quarter's margin is not yet a stable baseline for next year. The CFO explained that third-party computing resources were not used until late in Q3 to make up for insufficient in-house capacity, so the impact on the quarter's margin was limited; as usage expands in Q4, Cloud margins will come under pressure in the near term. This means the company is willing to accept some lower-margin supply arrangements to generate revenue sooner. Official earnings call
Another favorable base effect also needs to be taken into account. The company recognized a US$3.5 billion EU fine in Q3 last year, and this comparison effect partly explains the decline in general and administrative expenses this quarter. For illustration only, adding back the US$3.5 billion to last year's operating profit and holding all other items constant gives an increase of approximately 16.8% for this quarter, below the reported 29.9%. This is not company-adjusted profit and does not eliminate other legal expenses in the current quarter, but it shows that the improvement in operating leverage this quarter cannot be attributed entirely to AI efficiency. 10-Q, explanation of expense changes
Assessment: The group's core operations continue to generate more profit, and Cloud has become an important source of incremental profit. However, extrapolations of future profit should be more conservative. Third-party capacity, shared model expenses, and a larger depreciation base will all compete for the same incremental revenue.
Lower net income is not direct evidence that AI investment has failed
Q3 non-operating income and expenses swung from a positive US$12.759 billion last year to a negative US$8.221 billion. Gains and losses on equity securities swung from a positive US$10.734 billion to a negative US$8.664 billion, with the official earnings call pointing primarily to unrealized losses caused by changes in SpaceX's share price. The earnings release estimated that equity securities losses reduced net income after tax by approximately US$6.7 billion and EPS by approximately US$0.55 this quarter.
Adding 0.55 back to 2.12 gives 2.67, but this is merely a mechanical calculation excluding that one effect and cannot be treated as recurring EPS with all non-recurring items accounted for. Conversely, consolidated net income for the first three quarters reached US$201.239 billion, which also included substantial investment valuation gains. Investment gains cannot be treated as evidence of operating strength in the first half of the year while investment losses in the second half are treated only as noise to be ignored.
In addition, consolidated net income this quarter was US$26.468 billion; after deducting US$298 million in dividends attributable to preferred stock, net income available to common shareholders was US$26.17 billion. For common shareholders, investment gains, preferred shareholders' claims, and the share count all affect the profit ultimately available to them. Assessing AI operating performance should begin with operating profit, while valuing the common stock requires completing this additional step. Earnings release income statement and non-operating reconciliation
Cash flow pressure has expanded from a single quarter to the first three quarters
Amounts are in billions of US dollars.
Metric | 2025 Q3 | 2026 Q3 | First three quarters of 2025 | First three quarters of 2026 |
|---|---|---|---|---|
Operating cash flow | 48.414 | 42.290 | 112.311 | 127.149 |
Cash purchases of equipment | 23.953 | 51.355 | 63.596 | 131.953 |
Free cash flow | 24.461 | (9.065) | 48.715 | (4.804) |
Quarterly figures are from the Q3 earnings release FCF reconciliation, and cumulative figures are from the 10-Q cash flow statement. Cumulative FCF is calculated by this report.
Operating cash flow for the quarter fell by approximately US$6.1 billion year over year, while equipment payments increased by approximately US$27.4 billion, putting pressure on FCF from both sides. Operating cash flow for the first three quarters still rose 13.2% year over year, so it would be incorrect to say the company's ability to collect cash deteriorated for the full year; but equipment spending doubled, turning FCF for the first three quarters from a positive US$48.715 billion to a negative US$4.804 billion. FCF for the trailing twelve months remained positive at US$19.747 billion, also well below the approximately US$73.3 billion recorded for full-year 2025.
The CFO added that operating cash flow this quarter was affected by TPU inventory and a US$5.2 billion fine payment. Even adding back only this fine and holding other conditions constant, Q3 FCF would still be approximately negative US$3.865 billion. This sensitivity calculation shows that the one-time payment increased the pressure but was not the entire reason for the cash shortfall.
Inventory requires further tracking from a temporary use of cash through to actual collection. Inventory rose from US$2.439 billion at the beginning of the year to US$13.308 billion at the end of September; the change in inventory in the cash flow statement consumed US$10.959 billion during the first three quarters. The two figures are close but have different definitions: the change in the balance includes effects such as consolidation, so they cannot be used interchangeably. The company has explicitly linked the inventory buildup to TPU sales, but has not broken out the customers, delivery dates, or gross margins for each inventory item. Strong orders and rising inventory can coexist; if delivery or payment is delayed, cash recovery will still slow.
The company maintained its full-year equipment spending guidance of US$195 billion to US$205 billion. Subtracting the US$131.953 billion already paid in the first three quarters implies approximately US$63 billion to US$73 billion remains to be paid in Q4. This is the difference implied by full-year guidance, not new company guidance for a single quarter. Management also expects capital expenditures to increase significantly in 2027, so a natural transition to a harvest period next year cannot be treated as the base case.
Assessment: Cash flow is the clearest warning sign at present. It does not imply a short-term funding breakdown, but it demonstrates that cash generated by core operations has not yet covered all equipment payments in this investment cycle, let alone fully funded acquisitions, settlement of equity compensation, and other investments. Progress in the next phase should mean that revenue growth begins to improve cash flow after investment, rather than merely producing more inventory and larger accounting profits.
Six-year straight-line depreciation and how long equipment can generate returns are two separate questions
Alphabet's financial accounting policy uses the straight-line method, which spreads depreciation evenly over the useful life. Servers and network equipment are generally depreciated over six years, and data center buildings over seven to forty years, with depreciation beginning only when an asset is ready for its intended use. Approximately 65% of Q3 technical infrastructure investment was for servers and network equipment, and the remaining approximately 35% was for data centers. 2025 10-K, PP&E policy, Q3 earnings call
Six years was not the original useful life. In January 2023, Alphabet extended the estimated useful life of servers from four to six years and that of some network equipment from five to six years; this change in accounting estimate reduced 2023 depreciation expense by US$3.9 billion and increased net income by US$3 billion. Capital expenditures then expanded rapidly, and depreciation expense still rose substantially:
Period | Depreciation of property and equipment (US$100 million) | Year-over-year change |
|---|---|---|
2023 | 119.46 | — |
2024 | 153.11 | +28% |
2025 | 211.36 | +38% |
First three quarters of 2026 | 219.55 | +45% (150.96 in the same period a year earlier) |
Sources: 2023 10-K, change in accounting estimate, 2025 10-K cash flow statement, Q3 10-Q cash flow statement
Peers do not agree on server useful lives, and some have reversed earlier adjustments:
Company | Server and network equipment useful life | Most recent adjustment |
|---|---|---|
Alphabet | Generally six years | Extended from four years (five years for network equipment) to six years in 2023 |
Microsoft | Two to six years | Range disclosed in fiscal 2026 10-K |
Meta | Five to 5.5 years | Extended the useful life of most equipment to 5.5 years in 2025, reducing depreciation by US$2.92 billion that year |
Amazon | Six years for most, five years for some | Extended from five to six years in 2024, then shortened the useful life of some equipment back to five years in 2025 because AI and machine learning technology was advancing faster, increasing depreciation by US$1.4 billion that year |
Sources: Microsoft fiscal 2026 10-K, Meta 2025 10-K, Amazon 2024 10-K, Amazon 2025 10-K
Amazon explicitly cited AI technology cycles as the reason for shortening useful lives. Alphabet still uses six years, at the longer end among peers; if it similarly shortens the period in the future, depreciation expense will rise without any change in cash spending, and reported margins will fall. This does not change cash flow, but it will change the basis on which the market values Alphabet using a price-to-earnings ratio.
Older-generation TPUs are still available for rent: support for the six-year useful life
One condition supports Alphabet's longer useful life and is difficult for peers to replicate: older-generation chips still have uses. Google Cloud's official price list still publicly quotes seven models across six generations of TPU, including the second-generation TPU v2:
TPU generation | On-demand | 1-year commitment | 3-year commitment | Number of quoted regions |
|---|---|---|---|---|
Ironwood | 12.00 | 8.40 | 5.40 | 2 |
Trillium(v6e) | 2.70 | 1.89 | 1.22 | 4 |
v5p | 4.20 | 2.94 | 1.89 | 2 |
v5e | 1.20 | 0.84 | 0.54 | 8 |
v4 pod | 3.22 | 2.03 | 1.45 | 1 |
v3 pod | 2.00 | 1.26 | 0.90 | 1 |
v2 pod | 1.50 | 0.945 | 0.675 | 2 |
Unit: US$ per chip per hour, using the lowest-priced region for each generation, accessed November 15, 2026. Source: Google Cloud TPU price list
The price list shows two things. First, older generations remain available for sale under on-demand and one-year and three-year committed-use plans; they have not been withdrawn. Second, there are also signs that older generations are being phased out: for pods, v2 through v4 remain available in only one or two regions and lack the short-term flexible plans offered for newer generations. The hourly price for v2 is higher than for v5e, which this report reads as Google not cutting older chip prices to clear them out as new products arrive, rather than as evidence that older chips are more valuable; the price list itself lists only prices and does not indicate that the two offer equivalent computing power per chip.
According to media accounts, Google AI infrastructure chief Amin Vahdat said in October 2025 that TPUs from seven or eight years earlier were still running at 100% utilization, and reiterated this in an October 2026 interview; the same executive also noted that older clusters cannot simply be repurposed for inference and that scheduling flexibility has limits. OfficeChai, Training Data podcast summary
Compared with NeoCloud providers that specialize in GPU rentals, the difference is the alternative use available for older equipment. For example, CoreWeave's 2025 10-K disclosed that computer equipment is depreciated over six years, committed contracts account for more than 98% of revenue, weighted-average contract duration is approximately five years, and Microsoft, its largest customer, accounts for approximately 67% of revenue. After contracts expire, the remaining carrying value must be supported by market prices for re-rental, while GPU rental prices are determined by supply and demand. This does not mean older GPUs cannot be rented out; secondary analysis indicates that some H100 contracts have been renewed at close to their original prices after expiration. The difference is that NeoCloud has no internal demand to absorb them. CoreWeave 2025 10-K, Electroneconomics
Assessment: TPUs provide more support for Alphabet's six-year useful life than NeoCloud has for its six-year useful life. Google controls its chips, compiler and scheduling system, and has its own workloads such as Search, YouTube, advertising and Gemini. Older-generation equipment can be rented externally or shifted to internal use, so residual value is not determined entirely by external rental prices. This assessment is an inference by this report: Alphabet does not disclose utilization, revenue or the proportion shifted to internal use for each TPU generation, and public prices can establish only that older generations remain on sale, not that they remain profitable.
The straight-line method spreads costs over the period of use, but equipment's earning power may not be distributed evenly. Newer-generation chips may use less power and provide more computing work for the same price, requiring a reassessment of older equipment's sale price, rental price or workload capacity. Proprietary TPU design and software optimization can extend the useful value of certain workloads, but that does not establish that all equipment can operate at its original price for six years; nor can declines in publicly quoted GPU rental prices be applied directly as the decline in Google's actual TPU revenue.
Two categories of assets must be distinguished here. For equipment retained in its own data centers, Alphabet bears depreciation and utilization risk; TPU systems held for sale are inventory, measured at the lower of cost and net realizable value, and cannot be subject to the six-year depreciation applied to equipment used by the company. Both are affected by technological change, but the effects reach financial statements and cash through different paths.
The key is whether four timelines align: the period during which equipment retains economic value, its accounting depreciation period, customer contract and payment periods, and the payment deadlines for financing and energy obligations. If customer revenue declines first while equipment still has carrying value and debt and electricity payments continue to come due, cash recovery may come under pressure even without an immediate impairment. Alphabet has not provided enough information to match each batch of equipment with customers and funding sources individually, so this report does not invent a complete return on investment for an AI project.
The largest new risk lies in connections among contracts and partners
At the end of September, group revenue backlog was US$567.7 billion, including US$560.8 billion for Cloud; the company expects slightly more than 55% of total backlog to be recognized over the next twenty-four months. This improves demand visibility, but it is neither cash already collected nor profit available for distribution within two years. In particular, the company began including contracts with an original duration of one year or less in its disclosures in 2026 Q1, so the change in scope must be addressed before comparing the figure with prior years.
The 10-Q states that backlog excludes cancelable contracts, making it a stronger commitment than an indication of intent that can be freely revoked; contractual obligations still do not eliminate payment or performance risk. Delivery conditions, disputes, customer liquidity, subsequent renewals and service costs must also be considered. The fact that it is called backlog does not mean all contract terms are the same.
Spending commitments on the other side warrant closer examination. The table below presents amounts reported at the end of September in US$ billions; the items differ in nature and cannot simply be added together as "debt already due".
Item | Amount | Economic meaning |
|---|---|---|
Significant purchase commitments | 924.4 | Includes infrastructure, inventory, energy take-or-pay, content and open purchase orders; 213.4 is due within twelve months |
Future payments for leases not yet commenced | 130.5 | Primarily data center and energy infrastructure, with longer-term payment obligations arising as leases commence |
Future funding commitments for equity investments | 21.9 | A different use of funds from capital expenditures |
Data center and energy backstop support | 75.7 | Contingent support obligations, of which 48.0 has been contracted with third-party data center providers and accounted for as credit derivatives |
Financial guarantees | 22.8 | Primarily supports counterparties' purchases of long-lead-time equipment |
Data from 10-Q, Future Cash Commitments and Contingent Commitments. Management emphasized that some contracts have variable pricing and quantity flexibility, and the maximum contracted amount may not equal the final amount paid. These amounts may also materialize in subsequent equipment, lease or operating cash expenditures, so they cannot all be added in full to a future CapEx model.
Crux AI makes these relationships concrete. It is an unconsolidated related-party joint venture formed by Alphabet and Blackstone and accounted for under the equity method (Blackstone has committed up to US$5 billion in additional funding). The company has US$16.8 billion from commercial contracts with it included in backlog, while also committing to provide up to US$10 billion in future data center and energy backstop support under certain conditions. This does not prove the orders are fictitious, nor can net revenue be obtained by subtracting US$10 billion from US$16.8 billion; it shows that Alphabet is simultaneously a supplier, investor and bearer of some infrastructure risk. 10-Q, Crux AI and related-party disclosures
For that reason, this report applies a stricter standard to customer diversification than simply "serving many businesses." Management lists customers including AI labs, financial institutions and traditional enterprises, and says most Cloud backlog comes from general GCP contracts, supporting the breadth of demand sources; however, the company does not provide a complete breakdown of customer concentration in Cloud backlog. A broad group-wide advertising customer base cannot substitute for credit analysis of large cloud contracts themselves. If partner financing or construction starts are delayed, Alphabet could simultaneously face deferred revenue, slower inventory recovery and increased support obligations.
This is the mechanism comparable to the fiber-optic investment boom around 2000. GAO's 2002 record of the Global Crossing case lists financial assessment factors including excess industry capacity, competition and falling prices, showing that building a network and earning an adequate return are not the same thing. Alphabet today has stronger existing cash sources and multiple revenue streams, so the bankruptcy outcome of that period cannot be directly applied; but between "industry demand does exist" and "every additional capital investment earns a good return" lie pricing, utilization, customer credit and fixed obligations. This report uses this history as an analytical framework, not as a prediction that Alphabet will repeat the crisis. GAO, Global Crossing case record, 2002
Management Is Choosing to Reserve More Capital for AI
The cash flow statement for the first three quarters lists US$42.87 billion in net proceeds from common stock issuances, US$19.063 billion in net proceeds from mandatory convertible preferred stock issuance, and US$85.222 billion in net proceeds from debt issuance; debt repayments totaled US$8.879 billion over the same period. Common stock issuances included the June public offering, a private placement to a Berkshire affiliate, and Q3 ATM issuances. One quarter's proceeds cannot be treated as the full-year total, nor can gross proceeds from debt issuance be treated as net new debt.
The use of ATM proceeds is particularly important. The filing states that the proceeds are intended primarily to fund tax obligations related to employee equity awards; Q3 issuances raised approximately US$12.4 billion, with approximately US$27.6 billion remaining under the program. Describing all of it as capital raised directly to buy GPUs is inconsistent with the disclosed use of proceeds, but it reflects the same point: management is supplementing cash through share issuance, allowing more capital to remain in the overall investment program.
Total common shares outstanding rose from approximately 12.088 billion shares at year-end to 12.294 billion shares at the end of September, an increase of approximately 1.7%; no shares were repurchased during the first three quarters, although US$69.5 billion remained under the buyback authorization. This is an allocation choice; it cannot be said that the company has exhausted its repurchase authorization. The 6.25% mandatory convertible preferred stock also brings dividend and future conversion effects, both of which must be incorporated into the common shareholder return model. 10-Q, stockholders' equity and financing notes
Not all the capital went toward equipment built in-house. The Wiz acquisition closed in March at an adjusted purchase price of approximately US$29.467 billion, of which approximately US$22.705 billion was recorded as goodwill; Intersect's adjusted purchase price was approximately US$5.868 billion, in addition to assumed debt. The former strengthens multicloud and AI security, while the latter strengthens energy and data center development; strategically, both can support Cloud expansion. But net cash paid for acquisitions and purchases of intangible assets totaled approximately US$34.1 billion in the first three quarters, and is not deducted in the FCF measure the company typically cites. Acquisition returns cannot be assessed solely by looking at Cloud's growth rate, because that growth already includes the newly consolidated businesses.
Cash and marketable securities totaled approximately US$265.1 billion at the end of September, providing a substantial buffer. However, approximately US$90.4 billion of that amount consisted of marketable equity securities, which fluctuate with the market, and approximately US$75.2 billion of those securities consisted of SpaceX shares subject to near-term sale restrictions; the approximately US$174.7 billion remaining after their exclusion still includes investments such as bonds and is not entirely bank deposits. Long-term debt was approximately US$125.1 billion, with preferred stock, leases, and other obligations also outstanding, so the entire US$265.1 billion cannot be treated as net cash freely available for distribution.
Assessment: This allocation has a strategic rationale, but increases the risk borne by shareholders. Management is choosing to return less capital in the current period and raise more funds to compete for the next wave of computing capacity and enterprise customers. Whether it is correct should ultimately be tested by the after-tax return on incremental capital, improvement in cash flow per share, and partner risk, not by successful fundraising or a record backlog.
Three Weeks After Earnings: The Market First Penalized Cash Flow, Then Reassessed TPU
On the first trading day after earnings were released (October 29), GOOGL closed at US$283.82, down 12.6% for the day, on volume of approximately 140 million shares, about 5.5 times the daily average for the five trading days before earnings (October 21 to 27). Media outlets widely described this as Alphabet's largest single-day decline since its 2004 listing. Both earnings per share and total revenue fell short of LSEG consensus estimates; according to a UBS report cited by CNBC, Search & other revenue of US$63.35 billion was below market expectations of approximately US$64.9 billion. Cloud growth of 103% failed to offset concerns over the search miss and negative FCF for the quarter. Microsoft reported earnings the same day and lowered its full-year capital expenditures estimate from US$175 billion to US$170 billion, while Alphabet maintained its guidance; both companies' capital expenditures for the quarter were below analyst estimates. Shares of NeoCloud companies such as CoreWeave weakened in response, and the market began to worry about the pace of AI infrastructure expansion. The previous week, Meta shares also fell after free cash flow turned negative. Fortune, CNBC, analyst reaction, CNBC, capital expenditures
Date | GOOGL close (US$) | GOOGL daily change | QQQ daily change | Event |
|---|---|---|---|---|
10/28 | 324.89 | +1.3% | +0.6% | Q3 earnings released after market close |
10/29 | 283.82 | −12.6% | −1.4% | First trading day after earnings |
11/2 | 278.99 | −0.3% | −1.4% | Lowest close in three weeks |
11/5 | 282.57 | −2.2% | −6.5% | Technology stocks fell sharply; €6 billion corporate bond issuance completed |
11/9 | 288.15 | +1.2% | +3.5% | New generation of TPU introduced |
11/12 | 298.70 | +1.8% | −0.3% | Highest close in three weeks |
11/13 | 295.77 | −1.0% | −1.2% | Share price reference date for this report |
Source: Daily closing prices from Yahoo historical prices. Some media reports said the stock traded above US$300 intraday; this table uses closing prices throughout.
From the close before earnings through November 13, GOOGL fell 9.0%, while QQQ fell 6.3% over the same period; from its November 2 low, however, GOOGL had recovered 6.0%. This performance has two implications. First, the October 29 decline came almost entirely from company-specific factors, as QQQ fell only 1.4% that day. Second, on November 5, QQQ fell 6.5% in a single day, while GOOGL fell only 2.2%. After the repricing, the market did not regard Alphabet as the most vulnerable link in the AI spending cycle.
Analysts: Most Maintain Positive Ratings as Price Targets Are Broadly Cut
Firm | Rating | Price target (US$) | Source |
|---|---|---|---|
Citizens | Downgraded to Market Perform | — | CNBC |
BofA | Buy | 430 → 380 | CNBC |
BMO | Outperform | 480 → 425 | CNBC |
Evercore ISI | Outperform | 450 → 435 | Investing.com |
Wedbush | Outperform | 445 → 387 | Defense World |
Citi | Buy | 447 → 375 | Defense World |
UBS | Neutral | 380 → 332 | CNBC |
Wells Fargo (11/2) | Overweight | 371 → 365 | GuruFocus |
Morgan Stanley | Overweight | Maintained at 375 | CNBC |
Sources: CNBC, Investing.com, Defense World, Wedbush, Defense World, Citi, GuruFocus, MarketBeat. The original analyst reports are not public; all of the above is as reported by the media.
The prevailing sell-side response was to cut price targets without lowering ratings, although Citizens did downgrade its rating. According to CNBC's compilation, Bernstein's assessment was broadly that Alphabet is likely to be an AI winner, but not now; Baird described the stock as entering the “penalty box.” Several aggregation sites show the consensus price target falling from approximately US$430 before earnings to approximately US$410; their methodologies differ, and this report has not checked each site individually.
Principal Bull and Bear Arguments
Bull arguments
- Cloud and TPU are new growth engines. Cloud revenue reached US$30.7 billion in a single quarter; according to reports, TPU will enter Oracle's cloud beginning in 2027, and Google has also begun allowing customers to deploy TPU in their own data centers, directly challenging Nvidia. Yahoo Finance, Oracle, Motley Fool
- Search usage has not eroded. The Q3 release stated that year-over-year growth in search queries was the highest in nearly five years; bulls argue that the revenue miss reflects a lag in monetization rather than lost demand. Q3 release
Bear arguments
- Free cash flow has been negative for two consecutive quarters. It was negative US$5.855 billion in Q2 and negative US$9.065 billion in Q3; PPC Land estimates that, based on Q4 capital expenditures guidance, Q4 could be the third negative quarter unless operating cash flow rises substantially. Management also said investment would increase again in 2027. Q3 release, including FCF for the past four quarters, PPC Land
- Buybacks stopped while shares increased. There were no buybacks in the first three quarters, and common shares increased approximately 1.7% (see the preceding section), clearly pushing shareholder returns lower in the order of priorities.
- AI summaries could reduce advertising space. Some market participants interpret the search revenue miss as a sign that AI interfaces are beginning to affect monetization efficiency.
- Third-party capacity pressures Cloud margins. Management has indicated that Cloud margins will be under pressure in Q4, and the market is concerned that high margins cannot be maintained as the business scales.
Events Affecting Market Sentiment
- November 5: €6 billion corporate bond issuance completed. Alphabet disclosed in an 8-K that it had completed the underwritten offering under an existing S-3 registration, the latest example of the “continued access to external funding” discussed earlier in this report. 8-K
- November 9: New generation of TPU (8i Max / 8tx) introduced. According to reports, Nvidia shares fell approximately 5.7% that day, with some reports attributing the decline to the threat TPU poses to GPU pricing power; however, Nvidia also announced that day that its board had launched an independent investigation into reports concerning its CEO, so the decline cannot be attributed entirely to TPU. Invezz
- November 10: Media reports citing Anthropic's amended S-1 said Google would acquire approximately US$10 billion in shares at the IPO price. Reports differed on whether this was a firm commitment, an option, or part of an existing commitment; this report has not found an original announcement from Alphabet. If true, this would be another increase in AI-related capital commitments. FX Leaders
- November 12: An opinion by an Advocate General of the EU Court of Justice recommended reinstating the €1.49 billion AdSense fine. The opinion is not binding, and a judgment is expected in 2027. The Star (Reuters reprint)
- November 13: Gemini 4 Hydrogen and AI glasses introduced. The share price moved between the product announcements and spending concerns, rising intraday to a high of approximately US$305 before closing down 1.0%. GuruFocus
Assessment: The market correction in the three weeks after earnings is directionally consistent with this report. Sell-side firms broadly lowered price targets while most maintained positive ratings, indicating that they still accept Alphabet's competitive advantages but have pushed back the expected timing of returns. The euro-denominated corporate bonds and reports of the Anthropic stake have turned “continued capital commitments” from a figure in the earnings report into something still occurring after earnings. The market has begun to discount the cash shortfall, but GOOGL's current price of approximately US$296 still does not provide a sufficient margin of safety to ignore capital recovery risk, as discussed in the next section.
After the Share Price Decline, What Pace of Capital Recovery Justifies the Valuation?
On November 13, GOOGL closed at US$295.77 and GOOG at US$292.52. Using the share counts for the three classes of common stock at the end of September, with Class A and B valued at the A share price and Class C at the C share price, common equity market capitalization was approximately US$3.62 trillion. This is an approximation across different dates that uses the A share price as a proxy for B shares and does not include all future preferred stock conversions. Historical prices, Share count source
At the current market capitalization, the yield on approximately US$19.7 billion of FCF over the trailing twelve months is only approximately 0.55%. Even applying the approximately US$73.3 billion of FCF from 2025 to the same market capitalization produces a yield of approximately 2.0%. Neither figure is an estimate of permanently sustainable cash flow, but both show that the market is still paying a considerable price for increased future returns; the decline in the share price alone does not mean the investment cycle's risks are fully reflected.
Reversing the question is more useful. The following table holds the current common equity market capitalization at approximately US$3.62 trillion and only assumes FCF that could be generated in a future year; it is not company guidance, does not specify a year in which the figures will be reached, and is not a fair-value share price model.
Hypothetical annual FCF | Cash yield on current market capitalization | Operating evidence required |
|---|---|---|
US$70 billion | Approximately 1.9% | A return to near the 2025 level, still insufficient to produce a high yield from current-period cash alone |
US$120 billion | Approximately 3.3% | Operating cash increases, and equipment and inventory needs absorb additional cash more slowly |
US$180 billion | Approximately 5.0% | Search and Cloud expand together over the long term, with substantial cash remaining after asset replacement |
FCF in the table does not deduct preferred stock distributions, finance lease principal, acquisitions, or net cash payments related to settlement of employee equity awards; if these expenditures must continue, less cash will actually be available to common shareholders. Net payments related to equity compensation in the first three quarters were US$17.424 billion, an actual financing cash outflow, not a second deduction of all noncash SBC. The threshold is also higher than the figures suggest. Assuming cash expenditures on equipment remain at US$200 billion in a given year, leaving US$120 billion or US$180 billion in FCF would require operating cash flow of US$320 billion or US$380 billion, substantially above the current trailing-twelve-month figure of approximately US$179.6 billion. Future recovery can also improve through lower equipment needs, but management's current direction is for investment to increase again in 2027. The purpose of this sensitivity analysis is to translate “belief in AI” into specific capital recovery requirements, not to claim that any one row will necessarily materialize.
This report does not directly annualize this quarter's EPS or use gains on investment securities to inflate normalized earnings in a price-to-earnings model. At this stage, a more reasonable approach is to require the price to provide sufficient room for capital recovery, or to wait for improved evidence on cash and unit economics. Based on current disclosures, Alphabet cannot yet be regarded as a proven bargain.
Conclusion: Competitive Advantages Are Supported, but Capital Recovery Remains Unproven
From an industry position perspective, this quarter's data provides stronger confirmation than before of Alphabet's multilayered integration value. Search retains monetization capacity, Cloud revenue and operating income have grown enough to affect the group, and the new TPU systems bring the technology beyond its own cloud. Treating it solely as an advertising company losing its gateway to AI would miss the business expansion actually taking place.
For stock returns, however, this report is more cautious than before. FCF stayed at nearly the same level for three years and turned negative in the first three quarters of this year; Cloud's high margins have yet to reflect a larger scale of third-party capacity, while shared research and development, inventory, and equipment replacement still require funding. New commitments and partner support arrangements further require shareholders to understand who funds the demand and who bears delay and credit risk.
The strongest bull argument is that Alphabet can use the same investment in models and chips across search, consumer subscriptions, enterprise services, and hardware sales, with scale of usage reducing costs. The strongest bear argument is that the more opportunities arise, the more likely management is to continue investing, allowing competitive advantages to become low-priced services for customers first rather than high cash returns for common shareholders. The two are not mutually exclusive: the company can become more important while stock returns remain unsatisfactory.
Accordingly, this report maintains its assessment of “positive on business competitiveness, cautiously neutral on common shareholder returns.” At the next earnings report, the factors most likely to change this assessment will be whether TPU deliveries improve inventory and collections, how much incremental profit Cloud retains after third-party capacity increases, and whether 2027 investment guidance comes with clearer evidence of returns. Search also requires continued monitoring to determine whether it can retain revenue and profit growth amid a higher base and the transition to AI interfaces.
If these improvements begin to appear, this report will increase its confidence in investment recovery even if near-term FCF remains affected by capacity expansion; if revenue and backlog continue to reach new highs while the cash shortfall, dilution, and support obligations also expand, the valuation warranted should be reduced. This quarter has demonstrated Alphabet's ability to participate in the principal sources of AI revenue; what remains to be demonstrated is how much of that participation can be retained for each share.
Data and methodology: This report distinguishes realized company financial results, management outlook, and author inferences. Three years of annual data are based on the comparative tables in the 2025 10-K; quarterly and cumulative data are based on the 2026 Q3 release, 10-Q, and official earnings call. The original context comes from existing PVL research and locally saved versions; previously published articles were not changed. Equipment and customer contracts are not disclosed on a matched, case-by-case basis, so this report does not provide invented TPU gross margins, AI project ROIC, or customer default probabilities. Market data responses and calculations used for valuation are retained separately in local verification materials.
All content in this report is for research and learning purposes only and does not constitute investment advice.